2.13 手动逻辑函数图
章节大纲
-
Sketching rational functions by hand is a mental workout because it combines so many different specific skills to produce a single coherent image. It will require you to closely examine the equation of the function in a variety of different ways in order to find clues as to the shape of the overall function. Since computers can graph these complicated functions much more accurately than people can, why is sketching by hand important?
::手工拼写理性功能是一种精神锻炼,因为它结合了如此多的不同具体技能来生成单一的一致图像。 它需要您以不同的方式仔细检查函数的方程式,以便找到整个功能形状的线索。 由于计算机可以比人更准确地描述这些复杂的功能,为什么用手画图很重要?Graphing Rational Functions
::图形推理函数While there is no strict procedure for graphing rational functions by hand there is a flow of clues to look for in the function. In general, it will make sense to identify different pieces of information in this order and record them on a sketch.
::虽然手动绘制理性函数图没有严格的程序,但函数中却有线索可寻。 一般来说,按此顺序识别不同的信息并将它们记录在草图上是有道理的。Steps for Graphing Rational Functions By Hand
::用手绘制逻辑函数的步骤-
Examine the denominator of the rational function to determine the
domain
of the function. Distinguish between holes which are factors that can be canceled and
vertical
asymptotes
that cannot. Plot the vertical asymptotes.
::检查理性函数的分母以确定函数的域。 区分可以取消的空洞和不能取消的垂直空位。 绘制垂直空位 。 -
Identify the end behavior of the function by comparing the degrees of the numerator and denominator and determine if there exists a horizontal or
. Plot the horizontal or
.
::通过比较分子和分母的度,确定函数的最终行为,并确定是否存在水平或.绘制水平或 。 -
Identify the holes of the function and plot them.
::识别功能的洞穴并绘制图示 。 -
Identify the
zeroes
and
intercepts
of the function and plot them.
::识别函数的零和拦截并绘制图。 -
Use the
sign test
to determine the behavior of the function near the vertical asymptotes.
::使用符号测试来确定函数在垂直微粒附近的行为 。 -
Connect everything as best you can.
::尽你所能把一切连接起来
Now, apply those steps in graphing the following function:
::现在,应用这些步骤绘制下列函数的图形:
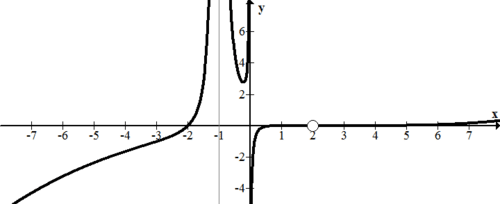
:xx) = 4x3 - 2x2+3x-18(x- 1) 2(x+2)
After attempting to factor the numerator you may realize that both and are vertical asymptotes rather than holes. The horizontal asymptote is . There are no holes. The - intercept is:
::尝试将分子乘数乘以后, 你可能意识到 x=1 和 x2 是垂直的静态, 而不是洞。 水平的静态是 Y=12 。 没有空洞。 y 界面是 :
::f(0)182=116The numerator is not factorable, but there is a zero between 0 and 1. You know this because there are no holes or asymptotes between 0 and 1 and the function switches from negative to positive in this region.
::分子是不可乘以的, 但0和1之间为零, 您知道这一点, 因为在 0和1之间没有洞或无症状, 并且此区域的函数切换从负向正 。Putting all of this together in a sketch:
::把这些都放在一个草图中:Examples
::实例Example 1
::例1Earlier, you were asked why sketching graphs by hand is important. Computers can graph rational functions more accurately than people. However, computers may not be able to explain why a function behaves in certain ways. By being a detective and looking for clues in the equation of a function, you are applying high level analytical skills and powers of deduction. These analytical skills are vastly more important and transferable than the specific techniques involved with rational functions.
::早些时候,有人问为什么用手绘制图表很重要。 计算机可以比人更准确地描绘理性功能。 但是, 计算机可能无法解释某种功能为何以某种方式运作。 作为侦探和寻找函数等式中的线索, 您正在运用高水平的分析技能和推算能力。 这些分析技能比与理性功能相关的特定技术更加重要和可转移。Example 2
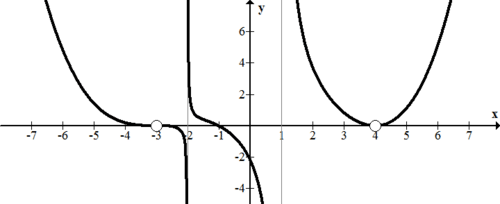
::例2Completely plot the following rational function.
::绘制以下的理性函数 。
::f(x) = (x- 3) 2(x-2) 3(x-1)(x+2) 300(x+1) 2(x-2)xxSince this function is already factored, much of the work is already done. There is a hole at (2, 0). There are two vertical asymptotes at . There are no horizontal or oblique asymptotes because the degree of the numerator is much bigger than the degree of the denominator. As gets large this function grows without bound . As get very small, this function decreases without bound. The function has no intercept because that is where a vertical asymptote is. Besides the hole at (2, 0), there are zeroes at (-2, 0), (1, 0) and (3, 0). This is what the graph ends up looking like.
::由于此函数已被系数化, 许多工作已经完成 。 在 x+++1, 0 上有一个洞。 在 x++++++++++++++++++++++++++++++++++++++++++++++++++++++++++++++++++++++++++++++++++++++++++++++++++++++++++++++++++++++++++++++++++++++++++++++++++++++++++++++++++++++++++++++++++++++++++++++++++++++++++++++++++++++++++++++++++++++++++++++++++++++++++++++++++++++++++++++++++++++++++++++++++++++++++++++++++++++++++++++++++++++++++++++++++++++++++++++++++++++++++++++++++++++++++++++++++++++++++++++++++++++++++++++++++++++++++++++++++++++++++++++++++++++++++++++++++++++++++++++++++Notice on the right portion of the graph the curve seems to stay on the -axis. In fact it does go slightly above and below -axis, crossing through it at (1, 0), (2, 0) and (3, 0) before starting to increase.
::图形右侧部分的注意 曲线似乎停留在 X 轴上。 事实上, 曲线确实略高于 X 轴下, 在开始上升之前, 穿过它(1, 0, 2, 0) 和 (3, 0) 。Example 3
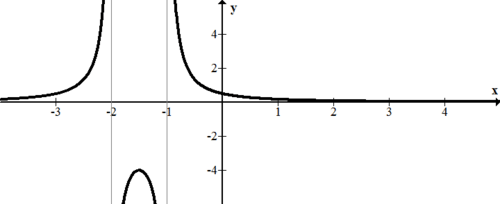
::例3Estimate a function that would have the following graphical characteristics:
::估计具有以下图形特征的函数:First think about the vertical asymptotes and how they affect the equation of the function. Then consider zeroes and holes, and the way the graph looks at these places. Finally, use the -intercept to refine your equation.
::首先考虑垂直的微粒, 以及它们是如何影响函数的方程式的。 然后考虑零和洞, 以及图形看这些位置的方式。 最后, 使用 Y 界面来完善您的方程式 。-
The function has two vertical asymptotes at
so the denominator must have the factors
.
::函数在 x+2 2, 1 时有两个垂直的单位数, 所以分母必须包含因子 (x+2)(x-1 ) 。 -
There is one zero at
, so the numerator must have a factor of
.
::x% 1 时为 1 0, 因此分子必须有一个系数 (x+1) 。 -
There are two holes that appear to override zeroes which means the numerator and denominator must have the factors
and
.
::似乎有两个孔取代零,这意味着分子和分母必须具有系数(x+3)和(x-4)。 -
Because the graph goes from above the
-axis to below the
-axis at
, the degree of the
exponent
of the
factor must be ultimately odd.
::由于该图从X轴上方到XQQQ3的x轴下方,(x+3)系数的指数程度最终必须是奇数。 -
Because the graph stays above the
-axis before and after
, the degree of the
factor must be ultimately even.
::由于图在x=4之前和之后停留在X轴上方,(x-4)系数的程度最终必须均衡。
A good estimate for the function is:
::该职能的良好估计是:
:This function has all the basic characteristics, however it isn’t scaled properly. When this function has a -intercept of -216 when it should be about -2. Thus you must divide by 108 so that the intercept matches. Here is a better estimate for the function:
::此函数具有所有基本特性, 但大小不正确 。 当 x=0 时, 此函数的 Y 界面为 - 216 。 因此, 您必须除以 108 才能截取 y 匹配 。 以下是该函数的更好的估计值 :
:Example 4
::例4Graph the following rational function:
::绘制以下合理函数图 :
:Here is the graph:
::以下是图表:Example 5
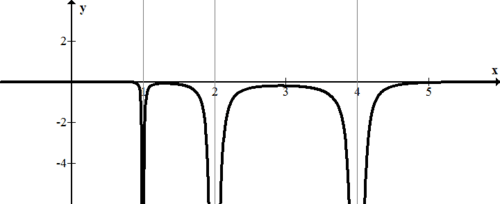
::例5Graph the following rational function:
::绘制以下合理函数图 :
:Here is the graph:
::以下是图表:
Summary -
To graph rational functions by hand take the following steps:
-
Examine the denominator to determine the domain, distinguish between holes and vertical asymptotes, and plot the vertical asymptotes.
::检查分母以确定域,区分孔和垂直微粒,并绘制垂直微粒。 -
Identify the end behavior by comparing the degrees of the numerator and denominator, and plot horizontal or oblique asymptotes.
::通过比较分子和分母的度,以及绘图水平或倾斜的微粒度,来识别最终行为。 -
Identify and plot the holes of the function.
::识别并绘制函数的空洞 。 -
Identify and plot the zeroes and intercepts of the function.
::识别和绘制函数的零和拦截。 -
Use the sign test to determine the behavior of the function near the vertical asymptotes
::使用符号测试来确定在垂直无符号区附近函数的行为 -
Put everything together.
::把所有东西都拼凑在一起
::亲手绘制理性函数时要采取以下步骤: 检查分母以确定域, 区分空洞和垂直静脉, 并绘制垂直静脉图 。 通过比较分子和分母的度, 以及绘制水平或倾斜的静脉图, 识别最终行为 。 识别和绘制函数的洞穴 。 识别和绘制函数的零和截取。 使用符号测试来确定垂直静脉图周围函数的行为 。 -
Examine the denominator to determine the domain, distinguish between holes and vertical asymptotes, and plot the vertical asymptotes.
Review
::回顾Use the function below for 1-7.
::1-7 使用以下函数。
::f(x) = 2 (x) = 2 (x) +4 (x) 3 (x) +1 8 (x) = 1 (x) 2(x) +2)1. Identify the vertical asymptotes and holes for the function.
::1. 确定函数的垂直空洞和空洞。2. What values will you use the sign test with in order to accurately sketch around the vertical asymptotes? Complete the sign test for these values.
::2. 您将使用什么值来使用符号测试来准确绘制垂直微粒周围的草图? 完成这些值的符号测试 。3. Identify any horizontal or oblique asymptotes for the function.
::3. 标明该函数的任何水平或倾斜性静态。4. Describe the end behavior of the function.
::4. 描述函数的最终行为。5. Find the zeroes of the function.
::5. 查找函数的零。6. Find the -intercept of the function.
::6. 查找函数的 Y 界面。7. Use the information from 1-6 to sketch the function.
::7. 使用 1-6 的信息绘制函数草图。Use the function below for 8-14.
::8-14 使用以下函数。
::g(x) = (x2- 9) (x2- 4) 5(x-2) 2(x+1) 28. Identify the vertical asymptotes and holes for the function.
::8. 确定函数的垂直空洞和空洞。9. What values will you use the sign test with in order to accurately sketch around the vertical asymptotes? Complete the sign test for these values.
::9. 您将使用什么值来使用符号测试来准确绘制垂直微粒周围的草图? 完成这些值的符号测试 。10. Identify any horizontal or oblique asymptotes for the function.
::10. 标明该函数的任何水平或倾斜性静态。11. Describe the end behavior of the function.
::11. 描述函数的最终行为。12. Find the zeroes of the function.
::12. 查找函数的零。13. Find the -intercept of the function.
::13. 查找函数的 Y 界面。14. Use the information from 8-13 to sketch the function.
::14. 利用8-13的信息绘制函数草图。15. Graph the function below by hand.
::15. 将以下的功能图解为手法。
::h(x) =x3+5x2+2x-8x2-3x-10Review (Answers)
::回顾(答复)Click to see the answer key or go to the Table of Contents and click on the Answer Key under the 'Other Versions' option.
::单击可查看答题键, 或转到目录中, 单击“ 其他版本” 选项下的答题键 。 -
Examine the denominator of the rational function to determine the
domain
of the function. Distinguish between holes which are factors that can be canceled and
vertical
asymptotes
that cannot. Plot the vertical asymptotes.