14.9 曲线下区域
章节大纲
-
Calculating the area under a straight line can be done with geometry. Calculating the area under a curved line requires calculus. Often the area under a curve can be interpreted as the accumulated amount of whatever the function is modeling. Suppose a car’s speed in meters per second can be modeled by a quadratic for the first 8 seconds of acceleration :
::直线下的区域可以用几何来计算。 以曲线线下的区域进行计算需要计算计算。 曲线下的区域通常可以被解释为任何功能模型的累积量。 假设汽车每秒以米计的速度可以用加速度前8秒的二次模型模拟:
:t) 秒= t2
How far has the car traveled in 8 seconds?
::8秒内车程有多远?Finding the Area Under a Curve
::在曲线下查找区域The area under a curve can be approximated with rectangles equally spaced under a curve as shown below. For consistency, you can choose whether the boxes should hit the curve on the left hand corner, the right hand corner, the maximum value, or the minimum value. The more boxes you use the narrower the boxes will be and thus, the more accurate your approximation of the area will be.
::曲线下的区域可以与以下曲线下相等的矩形相近。为了一致起见,您可以选择框是否打中左手角的曲线、右手角、最大值或最小值。您使用的框越小,框越准确,区域近似度就越准确。Subintervals are created when an interval is broken into smaller, equally sized intervals. The blue approximation uses right handed boxes for the height of each subinterval. The red approximation assigns the height of the box to be the minimum value of the function in each subinterval. The green approximation assigns the height of the box to be the maximum value of the function in each subinterval. The yellow approximation uses left handed boxes. Rectangles above the -axis will have positive area and rectangles below the -axis will have negative area in this context.
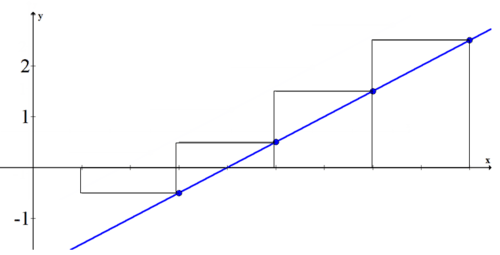
::当一个间隔被折成较小、同等大小的间隔时,会创建子interval。 蓝色近似值使用右手框来计算每个次interval的高度。 红色近近似值将框的高度指定为每个次interval 函数的最小值。 绿色近近似值将框的高度指定为每个次interval 函数的最大值。 黄色近近近似值使用左手的框。 X 轴上方的矩形将具有正区域, X 轴下方的矩形将在此背景下有负区域 。Using boxes to estimate the area under a curve is called a . Take the function . To calculate the Riemann Sum (area under the curve) between 1 and 9 of the function, first draw the graph and the boxes.
::使用框来估计曲线下的区域称为 a。 使用函数f( x) = 12x-2。 要计算函数 1 和 9 之间的 Riemann Sum( 曲线下的区域) , 请先绘制图表和框 。The area of the first box is 2 times the height of the function evaluated at 3:
::第一个框区域是3:评价的函数高度的2倍:Because this box is under the -axis, its area is negative.
::因为此框位于 X 轴下, 其区域为负 。The area for each of the rest of the boxes is 2 times the height of the function evaluated at 5, 7 and 9.
::其余每个框的面积是被评价为5、7和9的函数高度的2倍。The approximate sum of the total area under the curve is: square units.
::曲线下总面积的近似总和为:1+1+3+5=8平方单位。All four of the area approximations shown earlier get better as the number of boxes increase. In fact, the limit of each approximation as the number of subintervals(boxes) increases to infinity is the precise area under the curve.
::先前显示的所有四个区域近似值随着框数的增加而变得更好。 事实上,每个近似值的极限值是每条近近似值随着次中间数(框)增加至无限度而为曲线下的确切区域 。This is where the calculus idea of an integral comes in. An integral is the limit of a sum as the number of summands increases to infinity. A summand is one of many pieces being summed together.
::这就是一个整体的微积分概念出现的地方。一个整体是总和的限度,因为总和的数量会增长到无限。一个总和是被总和的众多部分之一。
::*f(x)=limni=1n(框一区域)The symbol on the left is the calculus symbol of an integral.
::左侧的符号是积分的微积分符号。Examples
::实例Example 1
::例1Earlier, you were asked to determine how far a car travels in 8 seconds. You can use the area under the curve to find the total distance traveled in the first 8 seconds. Since the quadratic is a curve you must choose the number of subintervals you want to use and whether you want right or left handed boxes for estimating. Suppose you choose 8 left handed boxes of width one.
::早些时候, 您被要求确定一辆车在 8 秒内行驶的距离。 您可以使用曲线下的区域来找到前 8 秒内行驶的总距离。 由于二次曲线是一个曲线, 您必须选择您想要使用的次间距数, 以及您是否想要用右手还是左手箱子来估算。 如果您选择了 8 个左手宽框 。0 1 2 3 4 5 6 7 Area of box to the right 1⋅0 1⋅1 1⋅4 1⋅9 1⋅16 1⋅25 1⋅36 1⋅49 The approximate sum is . This means that the car traveled approximately 140 meters in the first 8 seconds.
::大约总和为1+4+9+16+25+36+49=140,这意味着汽车在头8秒行驶约140米。Example 2
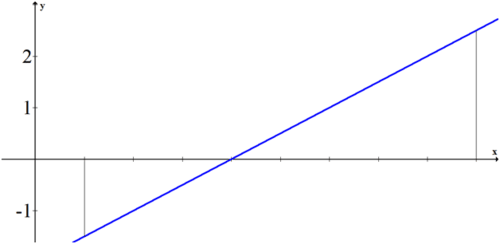
::例2Evaluate the exact area under the curve used earlier, , using the area formula for a triangle.
::使用三角形的区域公式,评价先前使用的曲线(f(x)=12x-2)下的确切区域。Remember that the area below the axis is negative while the area above the axis is positive.
::记住, x 轴下方的区域为负,X 轴上方的区域为正。Negative Area:
::负区域:12-3-1.5=94Positive Area:
::正面积:12-5-2.5=254Area under the curve between 1 and 8:
::1至8: 254-94=164=4的曲线下区域面积If you compare this answer to the approximation from earlier, it appears that approximations that are 2 units wide produce an area with significant error.
::如果将这个答案与先前的近似值比较,那么,如果近似值为2个单位宽,则似乎会产生出重大误差的区域。Example 3
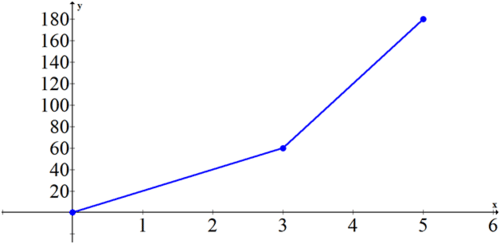
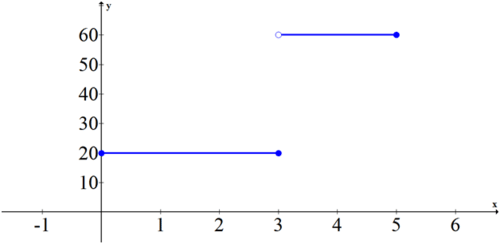
::例3Logan travels by bike at 20 mph for 3 hours. Then she gets in a car and drives 60 mph for 2 hours. Sketch both the distance vs. time graph and the rate vs. time graph. Use an area under the curve argument to connect the two graphs.
::洛根乘自行车在20mph旅行3小时。 然后她乘车驾驶60mph 2小时。 绘制距离图和时间图。 使用曲线参数下的一个区域连接两个图形 。Distance vs. Time:
::距离与时间 :Rate vs. Time:
::比率与时间 :The slope of the first graph is 20 from 0 to 3 and then 60 from 3 to 5. The second graph is a graph of the slopes from the first graph. If you calculate the area of the second graph at the key points 0, 1, 2, 3, 4 and 5 you will see that they align perfectly with the points on the first graph.
::第一个图的斜度是 0 到 3 的 20, 然后是 3 到 5 的 60 。 第二个图是 第一个图的斜度图。 如果您在 关键点 0, 1, 2, 3, 3, 4 和 5 上计算第二个图的区域, 您可以看到它们与第一个图的点完全吻合 。Area under curve from 0 to 0 0 1 20 2 40 3 60 4 120 5 180 Example 4
::例4Approximate the area under the curve using eight subintervals and right endpoints.
::使用8个次间距和右端端点,接近曲线下的区域。
::f(x) = 3x2 - 1, - 1x=7While a graph is helpful to visualize the problem and drawing each box can help give meaning to each summand, it is not always necessary. Since there are going to be 8 subintervals over the total interval of , each interval is going to have a width of 1. The height of each interval is going to be at the right hand endpoints of each subinterval (0, 1, 2, 3, 4, 5, 6, 7).
::虽然图表有助于直观问题, 并且绘制每个框可以帮助给每个总和带来意义, 但并非总有必要。 由于在 -1 x++7 的总间距中, 将会有 8 次间距, 每个间距的宽度将为 1 。 每个间距的高度将位于每个次间距的右手端点( 0, 1, 2, 3, 4, 5, 6, 7) 。
::i=07(3i2-1-1)1=412Example 5
::例5Approximate the area under the curve using twenty subintervals and left endpoints.
::使用20个次间距和左端点,接近曲线下的区域。
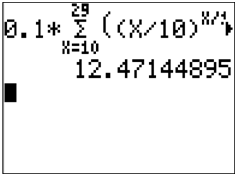
::f(xx) =xx, 1xx% 3When the number of subintervals gets large and the subintervals get extremely narrow it will be impossible to draw an accurate picture. This is why using summation notation and thinking through what the indices and the argument will be is incredibly important. With 20 subintervals between , each interval will be 0.1 wide. Left endpoints means that the first box has a height of and the second box has a height of .
::当子隔热器数量大而子隔热器数量极小时,将无法绘制准确的图片。这就是为什么使用加和符号符号和思考索引和参数将是何等重要的原因。如果在 [1,3] 之间有20个次隔热器,则每个间隔将为0.1宽。左端点意味着第一个框的高度为f(1),第二个框的高度为f(1.1)。
::80.1+f(1.1)0.1+f(1.2)0.1+f(1.2)01.01**************************************************************************************************************************************************************************************************************************************************************************************************************************************************************************************************************************************************************************************************Your calculator can compute summations when you go under the math menu.
::您的计算器可以在数学菜单下计算总和 。Summary -
Calculating the area under a curve can be interpreted as the accumulated amount of whatever the function is modeling, and requires calculus.
::在曲线下计算区域可被解释为无论该函数在建模中何种功能的累积量,需要微积分。 -
The area under a curve can be approximated with rectangles equally spaced under a curve, with more boxes leading to a more accurate approximation.
::曲线下的区域可以与曲线下相等的矩形相近,而更多的框可导致更准确的近似值。 -
Subintervals
are created when an interval is broken into smaller, equally sized intervals, and can be used to determine the height of the rectangles.
::当一个间距折成较小、同样大小的间隔时,即创建子间距,并可用于确定矩形的高度。 -
Using boxes to estimate the area under a curve is called a
Riemann Sum
, which is the sum of the areas of the rectangles.
::使用框来估计曲线下的区域,称为Riemann Sum,这是矩形区域的总和。 -
An
integral
is the limit of a sum as the number of summands (pieces being summed together) increases to infinity, and is represented by the calculus symbol of an integral.
::积分是指总和数增加至无限时总和数(总和数加起来)和以积分的微积分符号表示的总和数的限度。
Review
::回顾1. Approximate the area under the curve using eight subintervals and right endpoints.
::1. 使用8个次中间点和右端点,接近曲线下的区域。
::f(x) =x2 - x+1, 0x_82. Approximate the area under the curve using eight subintervals and left endpoints.
::2. 使用8个次中间点和左端点,接近曲线下的区域。
::f(x) =x2-2x+1, - 4x43. Approximate the area under the curve using twenty subintervals and left endpoints.
::3. 使用20个次间距和左端点,接近曲线下的区域。
::f(x) =x+3, 0x=44. Approximate the area under the curve using 100 subintervals and left endpoints. Compare to your answer from #3.
::4. 使用100个次间距和左端点,与曲线下区域相近,与3号中的答复相比。
::f(x) =x+3, 0x=45. Approximate the area under the curve using eight subintervals and left endpoints.
::5. 使用8个次中间点和左端点,接近曲线下的区域。
:6. Approximate the area under the curve using twenty subintervals and left endpoints.
::6. 使用20个次间距和左端点,接近曲线下的区域。
:7. Approximate the area under the curve using 100 subintervals and left endpoints.
::7. 使用100个次间距和左端点,接近曲线下的区域。
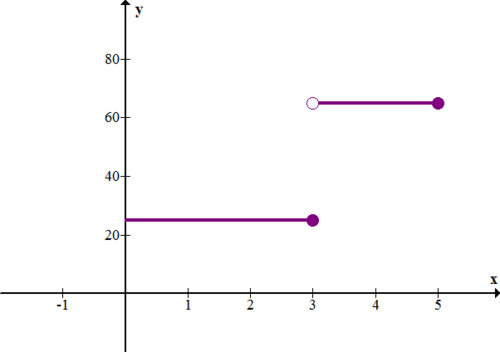
:The following graph shows the rate (in miles per hour) vs. time (in hours) for a car.
::下图显示汽车的车速(每小时英里)与时间(每小时)之比。8. Describe what is happening with the car.
::8. 描述汽车的情况。9. How far did the car travel in 5 hours?
::9. 汽车在5小时内行驶到多远?The following graph shows the rate (in feet per second) vs. time (in seconds) for a car.
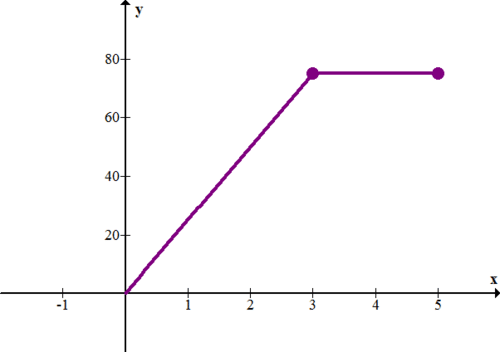
::下图显示汽车的速率(每秒每英尺)与时间(每秒)之比。10. Describe what is happening with the car. In particular, what is happening in the first 3 seconds?
::10. 描述一下汽车的情况,特别是前3秒的情况?11. How far did the car travel in 5 seconds?
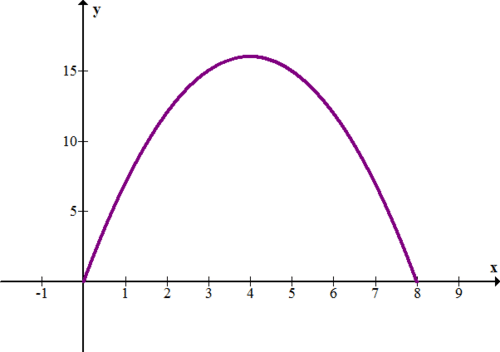
::11. 5秒钟内车程有多远?The following graph shows the function , which represents the rate (in feet per second) vs. time (in seconds) for a runner.
::下图显示函数 f(x) (x- 4) 2+16, 表示运行速度( 每秒以英尺计) 相对于运行速度( 秒数) 。12. Describe what is happening with the runner. In particular, what happens after 4 seconds?
::12. 描述赛跑者的情况,特别是4秒后会发生什么情况?13. Use rectangles to approximate the total distance (in feet) that the runner traveled in the 8 seconds. Try to get as good an approximation as possible.
::13. 使用矩形来估计跑者在8秒内行驶的总距离(以足计),尽量取得良好的近似值。14. Explain how an integral is like the opposite of a derivative.
::14. 解释一个有机体如何与衍生物相反。15. How do integrals relate to sums?
::15. 整体件与总额有何关系?Review (Answers)
::回顾(答复)Click to see the answer key or go to the Table of Contents and click on the Answer Key under the 'Other Versions' option.
::单击可查看答题键, 或转到目录中, 单击“ 其他版本” 选项下的答题键 。 -
Calculating the area under a curve can be interpreted as the accumulated amount of whatever the function is modeling, and requires calculus.