1.6 函数图变形:伸展、反射和压缩
章节大纲
-
Understanding how changes in the equation of a function result in stretching and/or reflecting and/or the graph of the function is a great way to take some of the mystery out of graphing more complicated equations. By recognizing the family to which a more complex equation belongs, and then identifying what changes have been made to the parent of that family, the graph of even quite detailed functions can be made much more understandable.
::理解函数方程式的变化如何导致函数的伸展和/或反射和/或图解,这是将一些神秘之处从更复杂的方程式图形化中解脱出来的一个绝妙方法。 通过识别一个更复杂的方程式所属的家庭,然后确定该家庭父子的哪些变化,甚至相当详细的函数的图可以更容易理解。See if you can identify what parts of the equation: represent either a stretch or a reflection of the parent function: before the review at the end of this concept.
::查看您能否确定等式的哪个部分 : y15x2 代表父函数的伸缩或反射 : y=x2 , 在此概念结尾处进行审查之前 。Function Transformations: Stretching, Compressing, and Reflecting
::函数转换:拉伸、压缩和反射Stretching and compressing graphs
::伸展和压缩图形If we multiply a function by a coefficient , the graph of the function will be stretched or compressed.
::如果我们将函数乘以系数,函数的图形将被拉伸或压缩。Given a function , we can formalize compressing and stretching the graph of as follows:
::根据 f( x) 函数, 我们可以正式化f( x) 图形的压缩和拉伸如下 :A function represents a vertical stretch of if and .
::函数 g(x) 代表 f(x) 的垂直伸展, 如果 g(x) = cf(x) 和 c> 1 。A function represents a vertical compression of if and .
::函数 g( x) 代表 f( x) 的垂直压缩, 如果 g( x) = cf( x) 和 0 < c < 1 。A function represents a horizontal compression of if and .
::函数 h(x) 表示如果 h(x) = f(cx) 和 c>1 的 f(x) 水平压缩 。A function represents a horizontal stretch of if .
::函数 h( x) 表示f( x) 的水平伸展, 如果 h( x) = f( cx) 0 < c < 1 。Notice that a vertical compression or a horizontal stretch occurs when the coefficient is a number between 0 and 1.
::注意当系数在0到1之间时会发生垂直压缩或水平拉伸。Take the function . We have multiplied by 3. This should affect the graph horizontally . However, if we simplify the equation, we get . Therefore the graph if this parabola will be taller/thinner than . Multiplying by a number greater than 1 creates a horizontal compression, which looks like a vertical stretch.
::获取 y= (3x) 2 函数 y = (3x) 。 我们已经将 x 乘以 3 。 这将水平影响图形。 但是, 如果我们简化方程, 我们就会得到 y= 9x2 。 因此, 如果该抛物线的值比 y= x2 高/ 深, 则图形。 乘以 x 乘以 大于 1 的数, 就会形成水平压缩, 看起来像垂直拉伸 。Take the function . If we simplify this equation, we get . Therefore multiplying by a number between 0 and 1 creates a horizontal stretch, which looks like a vertical compression. That is, the parabola will be shorter/wider.
::采取函数 y= (( 12) x 2. 如果我们简化此方程式, 我们就会得到 y= (14) x2. 因此乘以 x 乘以 0 和 1 之间的数字, 会产生水平拉伸, 看起来像垂直压缩 。 也就是说, 抛物线会缩短/ 宽度 。Reflecting graphs over the -axis and -axis
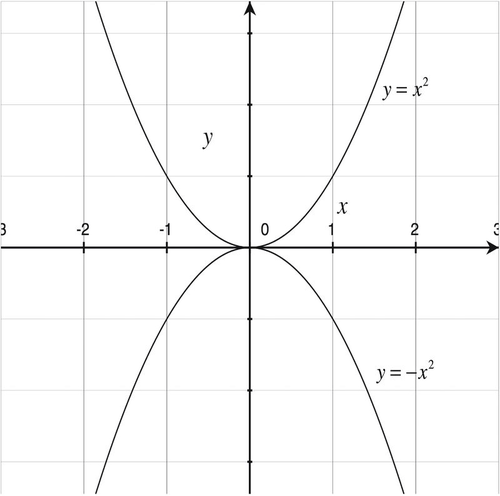
::Y 轴和 x 轴的反射图形Consider the graphs of the functions and , shown below.
::考虑下列函数 y=x2 和 yx2 的图形。The graph of represents a reflection of , over the -axis. That is, every function value of is the negative of a function value of . In general, has a graph that is the graph of , reflected over the -axis.
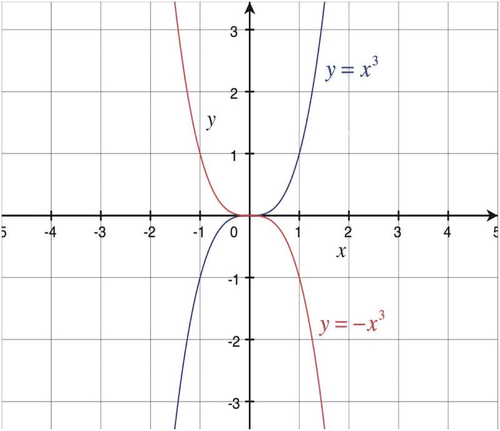
::yx2 的图形代表 x 轴的 Y=x2 的反射。 也就是说, yx2 的每个函数值是 y=x2 函数值的负值。 一般而言, g( x)\\ f( x) 的图形是 f( x) 的图, 反射到 x 轴 。Consider the graphs of and sketched on the same axes:
::考虑在相同的轴上绘制的 y=x3 和 yx3 的图形 :
At first the two functions might look like two parabolas as shown earlier. If you graph by hand, or if you set your calculator to sequential mode (and not simultaneous), you can see that the graph of is in fact a reflection of over the -axis.
::首先,这两个函数可能看起来像前面显示的两个参数。如果用手图,或者将计算器设置为顺序模式(而不是同步),您可以看到, yx3 的图形实际上是 X轴上的 Y=x3 的反射。However, if you look at the graph, you can see that it is a reflection over the -axis as well. This is the case because in order to obtain a reflection over the -axis, we negate . In other words, is a reflection of over the -axis. For the function . This is the same function as the one we have already graphed.
::然而,如果您查看图表,您可以看到它也是y轴的反射。 这是因为为了在y轴上取得反射, 我们否定了 x。 换句话说, h( x) =f( f)( x) 是y轴上的 f( x) 的反射。 对于函数 y=x3, h( x) = (-x) 3= (-x) = (-x) = (-x) = (-x) (-x) (x) = *xx3) 。 这与我们已经绘制的函数相同。It is important to note that this is a special case. The graph of is also a special case. If we want to reflect over the -axis, we will just get the same graph! This can be explained algebraically: .
::必须指出,这是一个特殊案例。 y=x2 的图形也是一个特殊案例。 如果我们想要在 y 轴上反映 y=x2, 我们只能得到相同的图表 ! 这可以解释代数 : y= (- x) 2 = (- x (- x) = x2 。Examples
::实例Example 1
::例1Earlier, you were asked to identify the transformations on that result in the function .
::早些时候, 您被要求识别 y=x2 上的转换导致 y=15x2 函数的转换 。The function: is the result of transforming by:
::函数 : y15x2 是y=x2 转换结果 :reflecting it over the axis, because of the negative co-efficient on the . and:
::在x轴上反射,因为x和:vertically compressing it (making it wider ), because of the co-efficient being a fraction between 0 and 1.
::垂直压缩(使其扩大),因为协同效率在0到1之间是分数。Example 2
::例2Graph the functions and .
::函数 y=xandyx 图形。The equation might look confusing because of the under the square root . It is important to keep in mind that means the opposite of . Therefore the domain of this function is restricted to values . For example, if . It is this domain, which includes all real numbers not in the domain of plus zero, that gives us a graph that is a reflection over the -axis.
::yx 等式可能会因为平方根下的 ~x 表示 -x 表示混淆。 重要的是要记住 ~x 表示 x 的反面。 因此, 此函数的域限为 ++0 。 例如, 如果 x4, y(- 4) = 4= 2, 则此域包含不在 y=x + 0 域内的所有真实数字, 给我们的图表是 y 轴的反射 。In sum, a graph represents a reflection over the -axis if the function has been negated (i.e. the has been negated if we think of ). The graph represents a reflection over the -axis if the variable has been negated.
::总而言之,如果函数被否定(即,如果我们想到y=f(x),y被否定),一个图代表 x 轴的反射。如果变量 x 被否定,该图代表 y 轴的反射。
Example 3
::例3Sketch the graph of by appropriately stretching the parent graph .
::绘制 y= 3x2 的图形, 适当拉伸父法 =x2 的图形。The graph of is the graph of the parent, , with each -coordinate multiplied by 3. The image below shows both the parent and the child function on the same axes.
::y= 3x2 的图形是父体 y=x2 的图形,每个 Y 坐标乘以 3 。 下图显示父体和子体在同一轴上的函数 。
Example 4
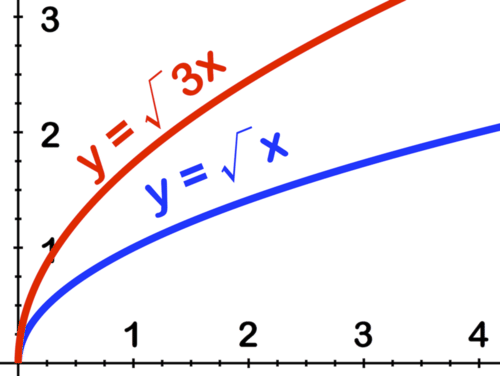
::例4Sketch the graph of by appropriately stretching .
::绘制 y =xby 的图形, 以适当的伸展性 = 3x 。The graph of is the graph of with each co- ordinate multiplied by 3, the image below shows both graphs.
::y=3x的图形是y=x的图形,每个坐标乘以3,下图显示两个图形。
Example 5
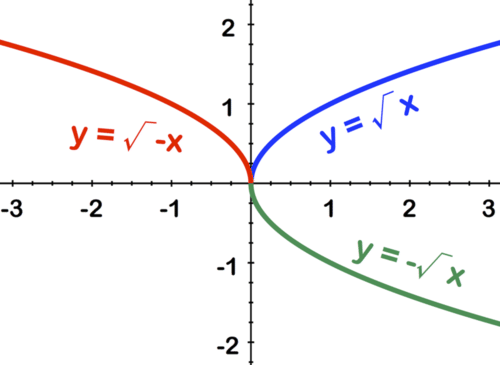
::例5Identify the function and sketch the graph of reflected over both axes.
::识别函数并绘制 y 表示轴的图形。To reflect the graph of over both axes, the function must be negated both outside and inside the root : . The negation (negative) outside of the root has the effect of reflecting the graph vertically, and the negation inside of the root reflects the graph horizontally. The image below shows three versions:
::要在两个轴上反射 y=x 的图形,函数必须从根的外部和内部反弹:yx。根的外部否定(负)效果是垂直反射图,根的反射效果是水平反射图。下图显示三个版本:-
(BLUE)
:布鲁)y=x
-
(GREEN)
: -
(RED)
:
Review
::回顾-
If a function is multiplied by a coefficient, what will happen to the graph of the function?
::如果函数乘以系数,函数的图形会怎样? -
What does multiplying
by a number greater than one create?
::x乘以一个大于一个的数会创造什么? -
What happens when we multiply
by a number between 0 and 1.
::当我们乘以 x 乘以 0 和 1 之间的数字时会发生什么? -
In order to obtain a reflection over the
axis what do we have to do to
?
::为了在Y轴上取得反射,我们要对x做些什么? -
How do we obtain a reflection over the
-axis?
::我们如何在 X 轴上取得反射? -
Write a function that will create a horizontal compression of the following:
::写入一个函数, 以创建以下水平压缩: f( x)=x2+3 -
Write a function that will horizontally stretch the following:
::写入将水平延伸以下的函数: f( x) =x2 - 6 -
Rewrite this function
to get a reflection over the
-axis.
::重写此函数 f( x) x 以获得 X 轴的反射 。 -
Rewrite this function
to get a reflection over the
-axis.
::重写此函数 f( x) =x 以获得 Y 轴的反射 。
For #10-17, graph using transformations. Identify the translations and reflections.
::对于#10-17, 使用变换的图表。 识别翻译和反射 。-
::f(xx) x2 -
::h(x)=x+3 -
::g(x)=1x+1 -
: -
::h(x) = (x+3) 3+1 -
: -
: -
:
Review (Answers)
::回顾(答复)Click to see the answer key or go to the Table of Contents and click on the Answer Key under the 'Other Versions' option.
::单击可查看答题键, 或转到目录中, 单击“ 其他版本” 选项下的答题键 。 -
(BLUE)