5.4 与 " 极量 " Riemann Summs一道的曲线下估计面积
章节大纲
-
Finding the of a function, f ( x ) , is one of the central problems that arises in Calculus. You already know how to compute the area of some simple function curve shapes using geometric formulas, and can sometimes quickly use these methods. But, what would you do if the function curves were more complex? The key approach of calculus is to take a simple method, apply it on a small scale, and then take it to the limit at infinity.
::函数 f( x) 的查找是计算时出现的核心问题之一。 您已经知道如何使用几何公式计算某些简单函数曲线形状的面积, 有时可以快速使用这些方法。 但是, 如果函数曲线更为复杂, 您会怎么做 ? 计算时的关键方法是采取一个简单的方法, 将它应用到一个小尺度上, 然后将其控制到无限的极限 。To gain some insight into the idea of finding the area under a curve, do the following before you go further: take a simple parabola curve (concave up and positive), divide an interval on the x -axis into a number of equal subintervals, and draw a rectangle in each subinterval that intersects the parabola. The summation of the rectangles would be an area estimate. How many different types of intersections can a rectangle make with the parabola? Can you say anything about how the intersection under or over estimates the area underneath the curve? Can you see that the more rectangles used for a given interval, the better the estimate?
::要深入了解在曲线下找到区域的想法,请在您进一步前进之前先做以下操作:使用一个简单的抛物线曲线(向上和正),将 X 轴的间距分隔为数等等量的子间距,并在每个子interval 中绘制一个相交于抛物线的矩形。矩形的相加将是一个区域估计值。在抛物线上,有多少种不同的交叉点可以产生矩形?您能否说明一下曲线下或以上的交叉点如何估计曲线下的区域?您能看到在给定的间距中使用的越多矩形,估计越好?Riemann Sums
::里伊曼苏姆For simple functions like f ( x ) = c ( c > 0 ) , or f ( x ) = c x ( c is a constant > 0 ) over some interval [ 0 , x 0 ] , we can use simple geometry to get the area under each curve (try confirming this on your own):
::对于 f( x) = c( c>0) 或 f( x) = cx ( c 是常数 > 0) 等简单函数, 在某些间隔 [ 0, x0] 范围内, 我们可以使用简单几何来获取每个曲线下的区域( 尝试自己确认 ) :-
For
f
(
x
)
=
c
(
c
>
0
)
; the area
A
is that of a simple rectangle,
A
=
c
x
0
.
::对于 f(x) = c(c>0); 区域 A 是 A= cx0 的简单矩形 。 -
For
f
(
x
)
=
c
x
(
c
>
0
)
; the area
A
is that of a simple triangle,
A
=
1
2
x
0
(
c
x
0
)
=
c
x
0
2
2
.
::对于 f(x) = cx(c>0); 区域 A 是简单三角形的面积 A= 12x0(cx0) = cx022。
How can the area be determined for more complex functions?
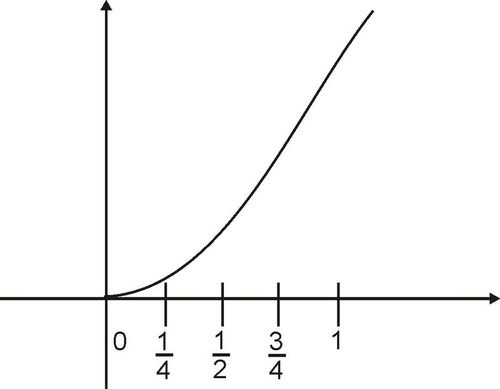
::如何为更复杂的功能确定区域?Let’s consider our basic quadratic function f ( x ) = x 2 . Suppose we are interested in finding the area, A , under the curve from x = 0 to x = 1 . The area we are talking about is the cross-hatched space under the curve shown below.
::让我们考虑一下我们的基本二次函数 f(x) =x2. 假设我们有兴趣在 x=0 至 x=1 的曲线下找到区域 A。 我们所说的区域是以下曲线下交叉覆盖的空间 。One way to estimate the area under the curve is to compute the area of the square that has a corner at (1, 1) as shown below, and then take half.
::估计曲线下区域的一种方法就是计算在(1、1)处有一个角的方形区域,如下文所示,然后取一半。This gives an area A = 1 2 . This is a good first estimate of the area; the exact answer will be shown to be A = 1 3 .
::这给出了区域 A=12。 这是对区域的很好的第一次估计; 准确的答案将显示为 A=13 。How can we make a better estimate? How about dividing the x -interval from x = 0 to x = 1 into multiple sub-intervals of equal widths.
::如何作出更好的估计? 如何将 x interval 从 x=0 到 x =1 分成多个等宽的子intervals 。Let’s look at problems each having more subintervals than the previous one.
::让我们来看看每个问题比前一个问题要多的次对数。4 equal subintervals:
::4 等於次对数 :Start by using four such subintervals as indicated:
::开始使用四个以下所示的次对等器:We now will construct four rectangles that will serve as the basis for our approximation of the area. The subintervals will serve as the width of the rectangles. We will take the length of each rectangle to be the maximum value of the function in the subinterval. (We could also choose the minimum or midpoint value of the function in the subinterval.)
::我们现在将构建四个矩形, 作为我们接近区域的基础。 子矩形的宽度将被作为矩形的宽度。 我们将将每个矩形的长度乘以次interval中函数的最大值。 (我们也可以选择次interval中函数的最小值或中点值 。)Hence we get the following figure:
::因此,我们得出以下数字:If we call the rectangles R 1 − R 4 , from left to right, then we have the areas
::如果我们将矩形R1-R4从左向右调用,那么我们就有了区域R 1 = 1 4 ⋅ f ( 1 4 ) = 1 64 , R 2 = 1 4 ⋅ f ( 1 2 ) = 1 16 , R 3 = 1 4 ⋅ f ( 3 4 ) = 9 64 , R 4 = 1 4 ⋅ f ( 1 ) = 1 4 ,
::R1=14f(14)=164,R2=14f(12)=116,R3=14f(34)=964,R4=14f(1)=14,so that the estimate of the total area under the curve is
::因此,曲线下总面积的估计数是:A ≈ R 1 + R 2 + R 3 + R 4 = 30 64 = 15 32 ≈ 0.4688.
::AR1+R2+R3+R4=3064=1532=0.4688。We call this area estimate the upper sum since it is based on taking the maximum value of the function within each sub-interval. Note that this approximation is very close to our initial approximation of 1 2 .
::我们称这个区域为上限,因为它是基于每个次间歇期内该函数的最大值。 请注意,这个近似值非常接近我们最初的12个近似值。8 Equal Sub-intervals:
::8 等分间隔:If we divide the interval into 8 equal sub-intervals, the width of each rectangle is now w = 1 8 .
::如果我们将间隔分隔为 8 等同的次对数, 则每个矩形的宽度现在为 w=18 。The area estimate now becomes:
::区域估计值现改为:A ≈ R 1 + R 2 + R 3 + R 4 + R 5 + R 6 + R 7 + R 8 ≈ 8 ∑ i = 1 R i Use of Sigma Notation ≈ 1 512 + 4 512 + 9 512 + 16 512 + 25 512 + 36 512 + 49 512 + 64 512 ≈ 204 512 A ≈ 0.3984
::AR1+R2+R3+R3+R3+R4+R5+R6+R6+R7+R8+R88i=1R使用Sigma Notation@1512+4512+9512+16512+25512+36512+49512+64512+204512A_0.3984Note that the Sigma Notation ( 8 ∑ i = 1 R i ) used above enables us to indicate the sum of the individual rectangle areas without the need to write out all of the individual terms. The sigma symbol with these indices tells us how the rectangles are labeled and how many terms are in the sum.
::请注意, 上面使用的 Sigma 符号 (8i=1Ri) 能够显示单个矩形区域的总和, 无需写出所有单个术语。 这些指数的 Sigma 符号告诉我们矩形的标签方式, 以及总和中有多少个术语 。In addition, the summation of rectangles that gives the area approximation could be written in the following general form:
::此外,提供区域近似值的矩形总和可以以下列一般形式写成:A ≈ R = n ∑ i = 1 R i = n ∑ i = 1 f ( w i ) ( x i − x i − 1 ) = n ∑ i = 1 f ( w i ) Δ x i
::AR=ni=1Ri=ni=1f(wi)(xi-xi-1)=ni=1f(wi)xiwhere we choose the value of n to be as large as we want, w i to be any value of x in the interval ( x i − x i − 1 ) , and ( x i − x i − 1 ) to be the i -th of n subintervals (not necessarily equal) in the interval [ a , b ] that f is defined on. This type of summation is called a .
::当我们选择 n 的值大小与我们所要的相同时, Wi 的值是X 在间隔(xi-xi-1)中的任何值, (xi-xi-1) 和 (xi-xi-xi-1) 的值是 n 次数的 ith (不一定相等) 在 f 定义的间隔[a,b] 中。这种总和类型被称为 。16 equal sub-intervals:
::16 等值次间隔 :If we now divide the interval into 16 equal sub-intervals, the width of each rectangle is now w = 1 16 .
::如果我们现在将间隔除以 16 相等的次间距, 每个矩形的宽度现在为 w= 116 。The area estimate now becomes:
::区域估计值现改为:A ≈ R 1 + R 2 + R 3 + R 4 + R 5 + ⋯ + R 16 ≈ 16 ∑ i = 1 R i Use of Sigma Notation ≈ 1 4096 + 4 4096 + 9 4096 + ⋯ + 196 4096 + 225 4096 + 256 4096 ≈ 1496 4096 A ≈ 0.3652
::R1+R2+R3+R3+R4+R4+R5+R5}R1616i=1Ri 使用西格玛名词=14096+44096+94096+94096+196496+2254096+254096+256496+256409614964096A}0.3652Again, the sigma notation has been used to eliminate the need to write out all of the individual terms.
::同样,这种污名表示也被用来消除写出所有个别术语的必要性。The table gives a summary of the area estimate results so far.
::该表汇总了迄今为止的地区估计结果。Estimated Area under f ( x ) = x 2 in the interval [0, 1] Sub-intervals
::子对数Area Estimate
::地区估计数1
1 (0.5)
4
0.4688
8
0.3984
16
0.3652
Intuitively, we have the feeling that we can improve the area approximation by sub-dividing the interval from x = 0 to x = 1 into more and more sub-intervals, thus creating successively smaller and smaller rectangles to refine our estimates.
::直观地说,我们有一种感觉,即我们可以通过将x=0至x=1之间的间隔分到越来越多的次间距来改进区域近似值,从而产生相继较小和较小的矩形来完善我们的估计数。We are now ready to formalize the use of sums to compute areas.
::我们现在准备正式确定使用资金计算地区。First, we define lower and upper sums:
::首先,我们定义下调和上调:Let f be a bounded function in a closed interval [ a , b ] and P = [ x 0 , … , x n ] the partition of [ a , b ] into n subintervals.
::让 f 成为封闭间隔 [a, b] 和 P = [x0,..., xn] 内 [a, b] 分割成 n 次隔年的连接函数 。Define the lower and upper sums, respectively, over partition P , by S ( P ) = n ∑ 1 m i ( x i − x i − 1 ) = m 1 ( x 1 − x 0 ) + m 2 ( x 2 − x 1 ) + … + m n ( x n − x n − 1 ) T ( P ) = n ∑ 1 M i ( x i − x i − 1 ) = M 1 ( x 1 − x 0 ) + M 2 ( x 2 − x 1 ) + … + M n ( x n − x n − 1 )
::以 S(P) =n1mi(xI-xI-1) =m1(x1-x0)+m2(x2-x1)+...+mn(xn-xn-xn-1)+...+mn(xn-xn-1)T(P)=n1MI(x1-xx1-1)=M1(x1-x0)+M2(x2-x1)+...+mn(xn-xn-1)where m i is the minimum value of f in the interval of length x i − x i − 1 and M i is the maximum value of f in the interval of length x i − x i − 1 .
::其中MI是xi-xi-1长度间隔中f的最小值,Mi是xi-xi-1长度间隔中f的最大值。S ( P ) and T ( P ) are Riemann sums, where m i and M i are particular choices for w i in the general Riemann sum formulation above.
::S(P)和T(P)是Riemann cumme, 米和米是上文Riemann sum一般配方中的wi的特殊选择。Next, we will link area under a curve with the limit of the lower or upper sums for an increasingly large number of subintervals:
::接下来,我们将在曲线下将区域与数量越来越多的次间隙值的下限或上限联系起来:Let f be a continuous non-negative function on a closed interval [ a , b ] . Let P be a partition of n equal sub intervals over [ a , b ] . Then the area under the curve of f is the limit of the upper and lower sums, that is
::在封闭间隔[a,b] 中,使 f 成为连续的非负负函数。让 P 成为[a,b] 中 n相等的子间隔。然后,f 曲线下的区域是上限和较低数额的界限,即A = lim n → + ∞ S ( P ) = lim n → + ∞ T ( P )
::A=limnS( P)=limnT( P)The following problem shows how we can use these definitions to find the area under a curve.
::以下的问题表明了我们如何利用这些定义来找到曲线下的区域。Show that the limit of upper sum for the function f ( x ) = x 2 , from x = 0 to x = x 0 , approaches the value A = x 0 3 3 .
::显示函数 f( x) =x2 的上限, 从 x=0 到 x=x0, 接近值 A=x033 的上限。Let P be a partition of n equal sub intervals over [ 0 , x 0 ] . By definition we have
::让 P 成为 [ 0, x0] 上 n 相等子间距的分割区T ( P ) = n ∑ 1 M i ( x i − x i − 1 ) = M 1 ( x 1 − x 0 ) + M 2 ( x 2 − x 1 ) + … + M n ( x n − x n − 1 )
::T(P) = n1MI(xI-xI- 1) = M1(x1-x0) + M2(x2-x1) +...+ Mn(xn-xn-1)Each rectangle will have width x 0 n , so that the evaluation of T ( P ) is: T ( P ) = n ∑ 1 M i ( x i − x i − 1 ) = M 2 ( x 2 − x 1 ) + … + M n ( x n − x n − 1 ) = ( x 0 n ) 2 x 0 n + ( 2 x 0 n ) 2 x 0 n + … + ( n x 0 n ) 2 x 0 n Equal length sub-intervals . = ( x 0 n ) 2 x 0 n ( 1 2 + 2 2 + 3 2 + … + n 2 ) = ( x 0 n ) 3 ( 1 2 + 2 2 + 3 2 + … + n 2 ) = ( x 0 n ) 3 ( n ( n + 1 ) ( 2 n + 1 ) 6 ) Makes use of : = ( x 0 3 6 ) ( n ( n + 1 ) ( 2 n + 1 ) n 3 ) n ∑ i = 1 i 2 = n ( n + 1 ) ( 2 n + 1 ) 6 T ( P ) = ( x 0 3 6 ) ( 1 + 1 n ) ( 2 + 1 n )
::每个矩形将具有宽度 x0n, 所以对 T( P) 的评审是 : T( P) = n% 1MI( xI- x- 1) = M2( x2- x1) +... +Mn( xn- xn- 1) = (x0n) 2x0n+( 2x0n) 2x0n+...+( nx0n) 2x0n_nEqual lax- intervals. = (x0n) 2x0x0n( 12+22+32+...+n2) = (x0n) 3( 12+22+32+...+...+n2) = (x0n) 3( n( n( n+1)( 2n+1) = n( n) (n( 2n+1)( 1n+1) n_ = 1) 6T( 1+1) ( 1+1) ( 1+1n) ( 2+1) ( 2+1n)O bserve that:
::注意:lim n → ∞ [ ( x 0 3 6 ) ( 1 + 1 n ) ( 2 + 1 n ) ] = ( x 0 3 6 ) ⋅ 2 = x 0 3 3
:x036)(1+1n)(2+1n)]=(x036)2=x033
The area, A , under the curve of the function f ( x ) = x 2 from x = 0 to x = x 0 , approaches the value A = x 0 3 3 . Note that if x 0 = 1 , we get the result A = 1 3 . Compare this value to the results from the previous problem.
::区域 A, 在函数 f(x) =x2 的曲线下, 从 x=0 到 x=x0, 接近值 A=x033. 请注意, 如果 x0=1, 我们得到结果 A=13。 比较此值与上一个问题的结果 。The same approach to determine the area can be used with S ( P ) , and it yields the same result, A = x 0 3 3 .
::S(P)可使用同一方法确定区域,结果相同,A=x033。Examples
::实例Example 1
::例1Earlier, you were asked about using rectangles to estimate the area under a curve. How many different types of intersections can a rectangle make with the parabola? Can you say anything about how the intersection under or over estimates the area underneath the curve? Can you see that the more rectangles used (smaller subinterval) for a given interval, the better the area estimate?
::早些时候, 有人询问您如何使用矩形来估计曲线下的区域。 矩形与抛物线之间有多少种不同类型的交叉点? 您能否对曲线下方或以上的交叉点如何估计曲线下方的区域做任何说明? 您能看到在给定间隔内使用的矩形越多( 较小次间距) , 区域估计越好吗 ?Where your rectangle intersects the parabola establishes the height of the rectangle, and just depends on the value of x within the subinterval: left end of rectangle (beginning of sub-interval), right end of rectangle (end of subinterval), or anywhere in between. For this concave up parabola, you should be able to see that using a left-end rectangle underestimates the area under the parabola; a right-end rectangle overestimates the area. A rectangle with height somewhere in between, say at the mid-point, might overestimate a portion and underestimate a portion, i.e., provide a better area estimate.
::矩形交错时, parbola 将确定矩形的高度, 并仅取决于次interval中的 x 值 : 矩形的左端( 次interval的起点) , 矩形的右端( 次interval的终点) , 或介于中间的任何地方 。 对于这个折叠在 parbola 的矩形, 您应该能看到, 使用左端矩形会低估 parbola 下的区域; 右端矩形会高估区域 。 在中间的某处, 如中间点, 有高处的矩形会高估一个部分, 并低估一个部分, 也就是说, 提供更好的区域估计 。Example 2
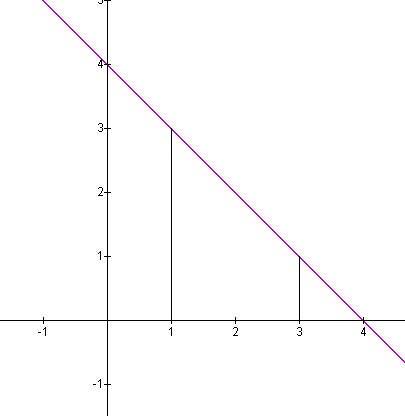
::例2Use the limit definition of area to find the area under the function f ( x ) = 4 − x from 1 to x = 3 .
::使用区域限值定义来查找函数 f(x)=4 - x 下的区域, 从 1 到 x= 3 。If we partition the interval [ 1 , 3 ] into n equal sub-intervals, then each sub-interval will have length 3 − 1 n = 2 n , and height 3 − i △ x as i varies from 1 to n . So we have △ x = 2 n and
::如果我们将间距[1,3] 分隔为 n等值次间隔,那么每个次间隔的长度为 3- 1n=2n, 高度为 3- ix 的长度为 1 到 n。 因此,我们有 x=2n 和 3- ix 的长度为 1 到 n。S ( P ) = n ∑ 1 m i ( x i − x i − 1 ) Lower sum using minimum function value in each subinterval . = n ∑ 1 ( 3 − i 2 n ) 2 n Sub-intervals of equal length . S ( P ) = n ∑ 1 m i ( x i − x i − 1 ) = n ∑ 1 ( 3 ⋅ 2 n ) − n ∑ 1 i ( 2 n ) 2 = 6 − ( 2 n ) 2 n ∑ 1 i = 6 − ( 2 n ) 2 ⋅ ( n ( n + 1 ) 2 ) Makes use of : = 6 − 2 ⋅ ( n ( n + 1 ) n 2 ) n ∑ i = 1 i = n ( n + 1 ) 2 S ( P ) = 6 − 2 ⋅ ( 1 + 1 n )
::S( P) =n1( 3- i2n) 2n 下拉值, 使用每次相隔值中的最小函数值 。 =n1( 3- i2n) 2n- 秒长度相等。 S( P) =n1mi( xi- xi-1) =n1 ( 3- xi- 2n) 2= n1( 3- 2n) 2- ( 2n) 2n- 2n( n( +1 1) 2) makes 使用 := 6- 2( n( n( +1) n2) ni=1i=n( n+1) 2S( P) =6- 2n) (1+1n) 。O bserve that:
::注意:lim n → ∞ [ 6 − 2 ⋅ ( 1 + 1 n ) ] = 6 − 2 = 4
::=6-2=4 =6-2=4 =1+1n]=6-2=2=4The area, A , under the curve of the function approaches the value A = 4 . The same approach can be used with S ( P ) , yielding the same result.
::区域 A , 在函数曲线下接近值 A=4。 S(P) 也可以使用同一方法,产生相同结果。Of course this example may also be solved with simple geometry. It is left to the reader to confirm that the two methods yield the same area.
::当然,这个例子也可以用简单的几何来解答,由读者来确认这两种方法产生相同的区域。Review
::回顾For #1-3, find S ( P ) and T ( P ) under the partition P .
::#1-3,在分区P下找到S(P)和T(P)。-
f
(
x
)
=
1
−
x
2
,
P
=
{
0
,
1
2
,
1
,
3
2
,
2
}
::f(x) = 1 - x2, P0, 12, 1,32,2} -
f
(
x
)
=
2
x
2
,
P
=
{
−
1
,
−
1
2
,
0
,
1
2
,
1
}
::f(x) = 2x2, P1, - 12, 0, 12, 1} -
f
(
x
)
=
1
x
,
P
=
{
−
4
,
−
3
,
−
2
,
−
1
}
::f(x) = 1x, P4, - 3, - 2, - 1} -
Consider
f
(
x
)
=
2
−
x
from
x
=
0
to
x
=
2
. Use Riemann Sums with four subintervals of equal lengths. Choose the midpoints of each subinterval as the sample points.
::考虑 f( x) = 2 - x 从 x=0 到 x=2 。 使用 Riemann 和 4 个相同长度的次对数 。 选择每个次对数的中点作为抽样点 。 -
Repeat problem #1 using geometry to calculate the exact area of the region under the graph of
f
(
x
)
=
2
−
x
from
x
=
0
to
x
=
2
. (Hint: Sketch a graph of the region and see if you can compute its area using area measurement formulas from geometry.)
::重复问题 # 1 , 使用几何方法计算 f( x) =2 - x 的图形下区域的确切面积, 从 x=0 到 x=2 。 (提示: Slich a graph of the segnations, 并查看您能否使用几何区域测量公式来计算其区域 。 ) -
Repeat problem #4 using the definition of the definite integral to calculate the exact area of the region under the graph of
f
(
x
)
=
2
−
x
from
x
=
0
to
x
=
2
.
::重复问题 # 4 , 使用定义的确定有机体来计算 f( x) =2 - x 从 x=0 到 x=2 的图形下区域的确切面积 。 -
f
(
x
)
=
x
2
−
x
from
x
=
1
to
x
=
4
. Use Riemann Sums with five subintervals of equal lengths. Choose the left endpoint of each subinterval as the sample points.
::f( x) =x2 - xxx x=1 到 x=4。 使用Riemann Sums 和 5 个相同长度的子intervals。 选择每个子interval 的左端点作为样本点 。 -
Repeat problem #7 using the definition of the definite intergal to calculate the exact area of the region under the graph of
f
(
x
)
=
x
2
−
x
from
x
=
1
to
x
=
4
.
::重复问题 # 7 , 使用确定星际间界的定义来计算 f( x) =x2 - x 从 x= 1 到 x= 4 的图形下区域的确切面积 。 -
Consider
f
(
x
)
=
3
x
2
. Compute the Riemann Sum of
f
on [0, 1] under each of the following situations. In each case, use the right endpoint as the sample points.
-
Two sub-intervals of equal length.
::两个长度相等的次对接器。 -
Five sub-intervals of equal length.
::5个相同长度的次对接器。 -
Ten sub-intervals of equal length.
::10个相同长度的次对接器。 -
Based on your answers above, try to guess the exact area under the graph of
f
on [0, 1].
::根据上面的回答, 试着猜测 f 图中 [ 0, 1] 的确切区域 。
::考虑 f( x) = 3x2. 在以下每一种情况下, 计算在 [ 、 1] 的 Riemann 和 f 。 在每种情况下, 使用右端点作为样本点 。 两个相同长度的次对数 。 五个相同长度的次对数 。 十 个相同长度的次对数 。 根据上面的回答, 尝试在 [ 、 1] 的 f 图形下猜测准确区域 。 -
Two sub-intervals of equal length.
-
Consider
f
(
x
)
=
e
x
. Compute the Riemann Sum of
f
on [0, 1] under each of the following situations. In each case, use the right endpoint as the sample points.
-
Two sub-intervals of equal length.
::两个长度相等的次对接器。 -
Five sub-intervals of equal length.
::5个相同长度的次对接器。 -
Ten sub-intervals of equal length.
::10个相同长度的次对接器。 -
Based on your answers above, try to guess the exact area under the graph of
f
on [0, 1].
::根据上面的回答, 试着猜测 f 图中 [ 0, 1] 的确切区域 。
::考虑 f( x) = ex。 在以下每一种情况下, 计算 [ 、 1] 的 Riemann f 和 f 。 在每种情况下, 使用右端点作为样本点 。 两个相同长度的次间距。 五个相同长度的次间距。 十个相同长度的次间距。 根据以上回答, 尝试在 [ 、 1] 的 f 图表下猜想确切区域 。 -
Two sub-intervals of equal length.
-
Find the net area under the graph of
f
(
x
)
=
x
3
−
x
;
x
=
−
1
to
x
=
1
. (Hint: Sketch the graph and check for symmetry.)
::在 f(x) =x3 - x; x1 到 x=1 的图形下查找净区域。 (提示: 绘制图形并检查对称 。 ) -
Find the total area bounded by the graph of
f
(
x
)
=
x
3
−
x
and the
x
-axis, from to
x
=
−
1
to
x
=
1
.
::查找 f( x) =x3 - x 和 x 轴的图形从 x 1 到 x =1 所覆盖的总面积 。 -
Use your knowledge of geometry to evaluate the definite integral:
3
∫
0
√
9
−
x
2
d
x
::使用您对几何学的知识来评价确定的组成部分: 309- x2dx
(Hint: set y = √ 9 − x 2 and square both sides to see if you can recognize the region from geometry.)
:For #14-15, find the area under the curve using the limit definition of area.
::对于#14-15, 使用区域限值定义在曲线下找到区域 。-
f
(
x
)
=
3
x
+
5
from
x
=
2
to
x
=
6
.
::f(x) = 3x+5 x= 2 到 x= 6 。 -
f
(
x
)
=
x
2
from
x
=
1
to
x
=
3
.
:
Review (Answers)
::回顾(答复)Click to see the answer key or go to the Table of Contents and click on the Answer Key under the 'Other Versions' option.
::单击可查看答题键, 或转到目录中, 单击“ 其他版本” 选项下的答题键 。 -
For
f
(
x
)
=
c
(
c
>
0
)
; the area
A
is that of a simple rectangle,
A
=
c
x
0
.