8.12 ODE:来自斜坡场和同位素线的解决方案
章节大纲
-
When an analytic solution to a first order differential equation is hard to determine, or cannot be determined, a visual representation of the solution is useful. The slope field , a set of short line segments that indicate at a set of points in the , can provide an alternative to visualizing the solution curve(s).
::当对一阶差分方程的分析性解决方案难以确定或无法确定时,对解决方案的直观表示是有用的。 斜坡场,即一组短线段,在(x,y)的一组点上显示二氧化二氮,可以替代对解决方案曲线的直观表示。Solutions from Slope Fields and Isoclines
::Slope 字段和Isoclines的解决方案In this concept, we will only consider linear ODEs of the first degree, i.e. .
::在这个概念中,我们只考虑一级线性ODE,即dydx=F(x,y)。Each solution that is plotted in the -plane is called a solution curve . Solution curves can be generated from an analytic solution if one is available. The solution curves can be visualized, before trying an analytic method, by plotting the slope (or direction) field of the differential equation. The slope (direction) field is a set of short line segments through points and with slope . The slope field gives the direction of “flow” of the solution curve at each point.
::在xy-plane 中绘制的每个溶液都称为溶液曲线。如果有的话,溶液曲线可以从分析溶液中产生。在尝试分析方法之前,可以通过绘制差别方程的斜度(方向)场来视觉化溶液曲线。斜度(方向)字段是一组短线段,通过点(x,y)和斜度F(x,y)绘制。斜度字段为每个点的溶液曲线的“流程”提供方向。Slope fields can be plotted by either:
::缩放字段可以由以下任一绘制:-
creating a uniform grid of points
in the plane,
-computing the slope
at each point, and drawing a short line segment at each point with the applicable slope;, or
::在平面上建立一个统一的点网格(x,y),在每一点计算斜坡F(x,y),并在每一点与适用的斜坡绘制短线段;或 -
drawing lines of constant slope, i.e.,
, creating isoclines
::恒定坡度的线条,即 F(x,y)=k, 创建等离子线

An isocline (for constant ) is the line along which the solution curves have the same gradient . By calculating this gradient for each isocline, the slope field can be visualized; making it relatively easy to sketch approximate solution curves.
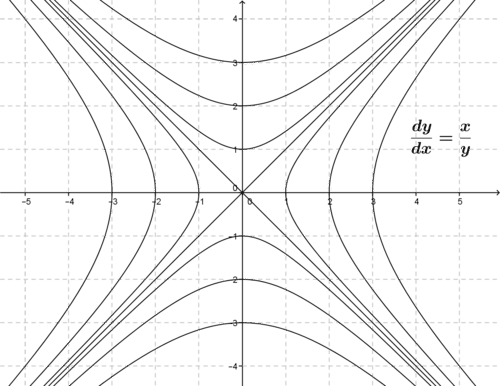
::等离子线(对于常数 k) 是溶液曲线具有相同梯度( k) 的线条。 通过计算每等离子线的这个梯度, 坡地可以被可视化; 比较容易绘制近似溶液曲线 。Take the ODE .
::采取ODE dydx=xy。The solution curve can be determined by first finding the analytic solution to the ODE as follows:
::解决办法曲线可通过首先找到对ODE的分析解决办法确定如下:
::dydx=xyydy=xxxxxxxxxxxxxxxxy=x22+C1y2=x2+Cyx2+CThe solution curves are plotted by choosing different values of (e.g., 0, 1, 4, and 9).
::溶液曲线通过选择不同的C值(如0、1、4和9)绘制。The slope field is determined by evaluating at different points to obtain , as shown in the figure.
::如图所示,斜坡字段通过在不同点(x,y)点对xy进行估评确定,以获得uddx。Notice how the slope field line segments outline the flow of the solution curves. When an analytic solution is hard to determine, the slope field can provide an alternative to visualizing the solution curve(s).
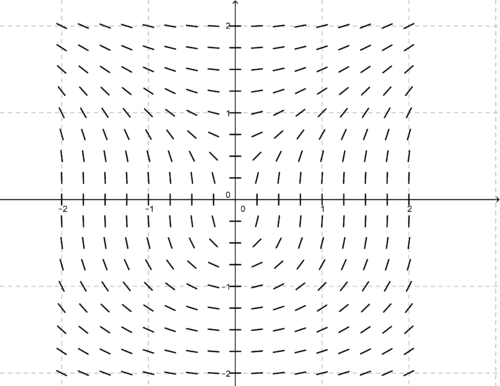
::注意斜坡场线段如何勾画溶液曲线的流量。 当分析性解决方案难以确定时, 斜坡场可以提供替代可视化溶液曲线的替代办法 。Now, consider the ODE .
::现在,考虑一下ODE dydx=xy2。The slope field is determined by computing over a grid of points, as shown below:
::斜坡场通过在(x,y)点网格上计算xy2来确定,如下所示:The solutions to the differential equation are of the form: . The solution curves are graphed below with the slope fields for comparison.
::差异方程式的解决方案是窗体: y3= 32x2+C。 溶液曲线下图与斜坡区比较。Examples
::实例Example 1
::例1For the differential equation , sketch the slope field and identify some isoclines. Then sketch the solution curves.
::对于 didx=1 -y 的差等方程, 绘制斜坡场图, 并确定一些等离子线。 然后绘制溶液曲线图 。Isoclines are determined by setting , where is a real constant, and solving for . The isoclines, therefore, are given by the horizontal lines .
::同位素线通过设置 dydx=k=1-y( k 是真实的常数) 和 y 的溶解确定。 因此, 等离子线由水平线 y=1-k 给出 。The slope fields are determined by using the isoclines to sketch short line segments with a given slope, or value.
::坡地的确定方法是使用等离子线绘制带有特定斜度或k值的短线段。The figure below shows a few isoclines (in red) and the slope field. Note that the slope field is symmetric about the line .
::下图显示几个等离子线(红色)和坡地。 请注意, 坡地与 y=1 (k=0) 的线对称。The following figure shows six solution curves for the differential equation. These solution curves all have the form , and the six curves are plotted for .
::下图显示差异方程的六个溶液曲线。这些溶液曲线均以 y = Ae-x+1 的形式存在,而六个曲线是为 A2, 1, 0.25 绘制的。Example 2
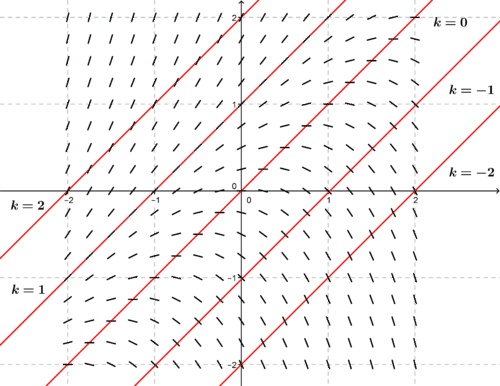
::例2For the differential equation , sketch isoclines and the slope field. Then, sketch a solution curve that passes through (1, 0).
::对于 didx=y - x 、 草图的等离子线和斜坡场。 然后, 绘制一个通过(1, 0) 的溶液曲线 。Selected isoclines (red) and slope fields (black) are shown below. Notice that the isocline passes through (1, 0).
::以下显示选定的等离子线(红)和斜坡场(黑)。请注意, k1 等离子线通过(1,0)。Review
::回顾-
For the differential equation
::对于 didx =x(1-y) 的差方程,绘制一些等离子线和斜坡场。 -
For the differential equation
, sketch some isoclines and the slope field.
::对于 didx =x2-6x+9, 绘制一些等离子线和斜坡场。 -
For the differential equation
, sketch some isoclines and the slope field.
::对于差方程式 dydx=(x+2)(y+5), 绘制一些等离子线和斜坡场。 -
For the differential equation
, sketch some isoclines and the slope field.
::对于 didx=lny, 绘制一些等离子线和斜坡场 。 -
For the differential equation
::对于 didx=xy, 绘制一些等离子线和斜坡场 。
Review (Answers)
::回顾(答复)Click to see the answer key or go to the Table of Contents and click on the Answer Key under the 'Other Versions' option.
::单击可查看答题键, 或转到目录中, 单击“ 其他版本” 选项下的答题键 。 -
creating a uniform grid of points
in the plane,
-computing the slope
at each point, and drawing a short line segment at each point with the applicable slope;, or