10.10 极地坐标系统和极地图
章节大纲
-
For an engineering class, Mariah developed a machine that flings a ping pong ball across the gymnasium. The distance the ball travels is a function of the angle of release. How can Mariah easily model the movement of the ping pong balls and predict where they’ll land?
::对于工程类来说,玛利亚开发了一台机器,在健身房对面抛掷一个乒乓球。球的距离是释放角度的函数。 玛利亚如何能轻易地模拟乒乓球的移动并预测它们会降落何处?Introduction to Polar Coordinates and Polar Graphs
::极坐标和极图介绍For most of your life, you’ve been graphing equations in rectangular form . In rectangular form, two axes, the -axis and the -axis, meet at a right angle at a point called the origin. Both axes continue forever in two directions. Points on the graph are described by an coordinate and a coordinate. The coordinate gives a location along the horizontal axis, and the coordinate gives a location along the vertical axis. Each set of coordinates describes exactly one point on the coordinate plane.
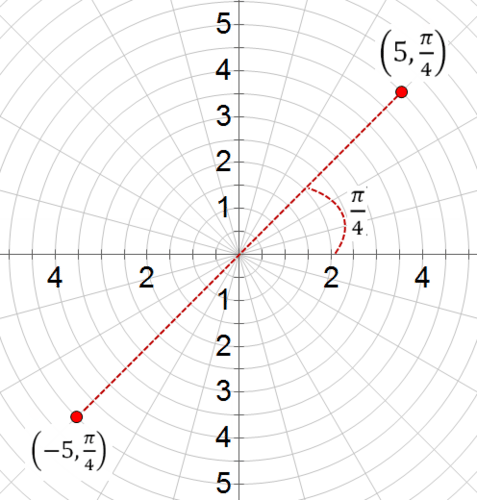
::在你一生的大部分时间里,您一直在以矩形形式绘制方程式图。在矩形形式中,两个轴、x轴和y轴以右角在原点相交。两个轴都以两个方向持续。图形上的点用 x 坐标和一个 y 坐标来描述。x 坐标给出了沿水平轴的位置,而 Y 坐标则给出了沿垂直轴的位置。每组坐标(x,y)都精确描述坐标平面上的一个点。In polar form , points in the plane are described in relation to a point, still known as the origin, and a polar axis, which is a ray that begins at the origin and continues on forever in one direction. Points in the polar plane are defined in terms of where is the distance from the origin and is the angle between the ray that connects to the origin and the polar axis. Below you will see the point .
::以极形表示, 平面上的点被描述为一个点, 仍称为起源, 和一个极轴, 即从起源开始, 并一直持续到一个方向的射线。 极平面上的点被定义为( r, r) , 其中 r 是起源的距离, 是连接( r, ) 到起源和极轴的射线之间的角。 下面您可以看到点 ( 5, 4)。Graphs in polar form can be especially useful for physics applications where angles are important, such as with projectile motion and acoustics.
::极形图对物理学应用可能特别有用,因为角度很重要,例如射线运动和声学。In polar form, an infinite number of coordinate pairs can represent the same point. That’s because if you add to any angle, you’ll have a different set of coordinates, but the location of the point will be the same. For instance, is in the same location as and . In addition, the polar form allows for both positive and negative radii. When is positive, it describes a distance along a ray that forms the angle θ with the polar axis. When is negative, it describes a distance along a ray that points in the opposite direction to the ray forming .
::在极地形式中,无限数量的坐标对可以代表同一个点。这是因为如果在任何角度中添加 2,你就会有一个不同的坐标组,但点的位置是一样的。例如, 6位于136 和 256 的同一位置。此外,极表允许正和负的半径。当 r 是正时,它描述一个射线的距离,该射线形成角度 与极轴的角。当 r 是负时,它描述射线的距离,该射线指向正和负的射线的相反方向 。Note that this means that, for example, and describe the same point.
::请注意,这意味着,例如,(5,4)和(-5,5,4)说明了同一点。There are several formulas that allow you to transform equations from polar form to rectangular form and from rectangular form to polar form. Some problems are easier to solve in one form, others are easier to solve in the other. If you learn to use these transformations, you’ll be able to simplify problems more easily. The formulas for transforming polar equations are:
::有几种公式允许您将方程式从极形转换为矩形,并将矩形转换为极形。有些问题比较容易解决,有些问题比较容易解决,有些问题比较容易解决。如果学会使用这些变形,那么您就可以更容易地简化问题。
::x2+y2=r2x=rcosy=rsinyx=tanThere are several ways to . You can graph them by hand using special graph paper or by using normal graph paper with a protractor and a ruler. You may also use a graphing calculator. If you do not own a graphing calculator, Wolfram Alpha provides a free online graphing tool.
::有很多方法可以 。 您可以使用特殊的图形纸或使用普通图形纸, 使用一个减号或标尺, 手工绘制图表。 您也可以使用图形计算器。 如果您不拥有图形计算器, Wolfram Alpha 提供一个免费的在线图形绘制工具 。For practice, let's f ind the point on the polar plane that corresponds to the rectangular point (3, 4).
::作为实践,让我们在极平面上找到与矩形点(3,4)相对应的点。From the transformation formulas you see that . So, and . To find , recall that . That means . Take the inverse tangent of each side to find that . The for the point are [5, .9273].
::从转换公式中,您可以看到 x2+y2=r2. 所以, 32+42=r2and5=r. 要查找\\\\\\\\\\\\\\\\\\\\\\\\\\\\\\\\\\\\\\\\\\\\\\\\\\\\\\\\\\\\\\\\\\\\\\\\\\\\\\\\\\\\\\\\\\\\\\\\\\\\\\\\\\\\\\\\\\\\\\\\\\\\\\\\\\\\\\\\\\\\\\\\\\\\\\\ x\\\\\\\\\\\\\\\\\\\\\\\\\\\\\\\\\\\\\\\\\\\\\\\\\\\\\\\\\\\\\\\\\\\\\\\\\\\\\\\\\\\\\\\\\\\\\\\\\\\\\\\\\\\\\\\\\\\\\\\\\\\\\\\\\\\\\\\\\\\\\\\\\\\\\\\\\\\\\\\\\\\\\\\\\\\\\\\\\\\\\\\\\\\\\\\\\\\\\\\\\\\\\\\\\\\\\\\\\\\\\\\\\\\\\\\\\\\\\\\\\\\\\\\\\\\\\\\\\\\\\\\\\\\\\\\\\\\\\\\\\\\\\\\\\\\\\\\\\\\\\\\\\\\\\\\\\\\\\\\\\\\\\\\\Now, let's find the point in rectangular form that corresponds to the point in polar form.
::现在,让我们以正方形的形式 找到与点[2,6]相对应的极形方形点。Remember that and .
::记住 x=rcos和y=rsin。
::2cos=6=xxx=32sin=6=yyy=1The point in rectangular form is .
::矩形的点是 (3,1) 。Regardless of which form you use to graph a function, the graphs will look the same. For some functions rectangular form will be easiest and for some functions polar form will be much easier.
::无论您用哪种形式来绘制函数, 图形将看起来是一样的。 对于某些函数的矩形形式, 某些函数的矩形形式将比较容易, 对于某些函数的极形形式则比较容易。Take the following equation in polar form.
::以极形表示以下方程式 。
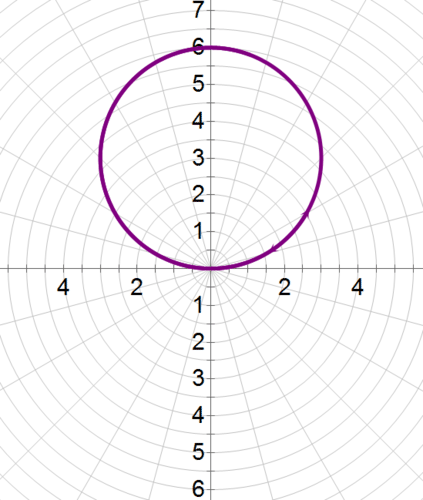
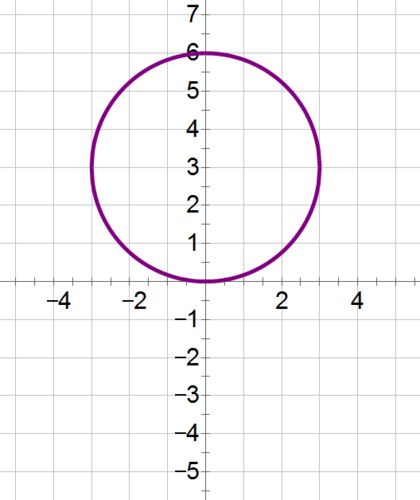
::r=6sin_______________________________________________________________________________________________________________________________________________________________________________________________________________________________________To transform this equation into rectangular form, multiply both sides by to get
::将方程转换成矩形形,将两边乘以 r 以获得
::r2=6rsinUse the transformation formulas to substitute so that you get . Use completing the square to put this equation into a more familiar form, then graph.
::使用变换公式替换 x2+y2=6y 。 使用完成方形将方形设置为更熟悉的形式, 然后图形 。
::x2+(y2-6y+9)=9x2+(y-3)2=9The equation is a circle with a center at (0, 3) and a radius of 3.
::方程式是一个圆形,中心在0,3,半径为3。Which form of the equation is easier to graph?
::哪种方程式比较容易图形化?Examples
::实例Example 1
::例1Earlier, you were asked about how Mariah can model the path and movement of ping pong balls. Polar coordinates present a natural solution to Mariah’s problem, since they express equations in terms of an angle and a distance, . Mariah knows that the equation can model her projectile’s motion in rectangular form. She’ll use the transformation formulas to find the same equation in parametric form. Then she’ll be able to use and to model the movement of her ping pong balls.
::早些时候,有人问到玛利亚如何能模拟乒乓球的路径和运动。 极地坐标为玛利亚的问题提供了一个自然的解决办法,因为极地坐标以角度 + 和距离表示方程式, r. Mariah知道该方程 y= 10x+5x2 可以以矩形形式模拟其投影体的运动。 她将使用变形公式以参数形式找到相同的方程式。 然后她将用 R 和 + 来模拟她的乒乓球运动。
::y=10x+5x2rsin 10rcos 5r2cos2 rsin rcos 10rcos 10rcos rcos 5r2cos2 rcos 10+5rcosr=tan 105cosNow she can graph her equation.
::现在她可以用图表来描绘她的方程了Example 2
::例2Put the following 4 points into polar form. (1, 1), (1, 4), (5, 1), (5, 4).
::将以下4点分为极形(1、1)、1、4、5、1)、5、4、4、4、5、4、4、5、4、4、5、4、4、4、5、4、4、4、4、3、4、4、4、4、3、4、4、4、4、4、4、3、4、4、4、4、4、4、4、4、4、4、6、6、4、4、4、6、6、6、6、6、4、4、6、6、4、4、6、6、4、4、6、6、4、4、6、4、4、6、6、4、4、6、4、6、4、4、4、6、6、6、6、4、4、4、6、6、6、6、6、4、4、4、4、4、7、7、7、7、7、6、7、7、7、7、7、7、7、7、7、7、7、7、7、7、7、7、7、7、7、7、7、7、7、7、7、7、7、7、7、7、7、7、7、7、7、7、7、7、7、7、7、10、10、10、10、10、10、10、10、10、10、10、10、10、10、10、10、10、10、10、10、10、10、10、10、10、10、10、10、10、10、10、10、4、4、10、10、4、4、4、10、10、10、10、10、10、10、10、10、4、4、10、10、10、10、10、10、10、10、10、10、10、10、10、10、10、10、10、10、10、10、10、10、10、10、10、10、10、10、10、10、10、10、10、10、10、10、10、10、10、10、10、10、10、10、10、10、10、10、10、10、10、10、For each point, you’ll need to find and .
::每一点,你都需要找到 R 和 。
:1,1,r2=x2+y2r2=2r=2tanyxtan14)
(1, 1) in polar form is .
::极形(1,1,1)为(2,%4)。
:(1, 4) in polar form is .
::极形(1,4)为(17,1.33)。
:(5, 1) in polar form is .
:
:(5, 4) in polar form is .
:Example 3
::例3Put the following 3 points into rectangular form. .
::将以下3点设为矩形(4,3,23,(2)6,(6,2)3)。For each point, recall that and .
::每个点, 请记住 x=rcos 和 y=rsin 。
:in rectangular form is .
::长方形的(4,3,23)为(2,23)。
:in rectangular form is .
::长方形(2,6)为(3,1)
:in rectangular form is .
:Example 4
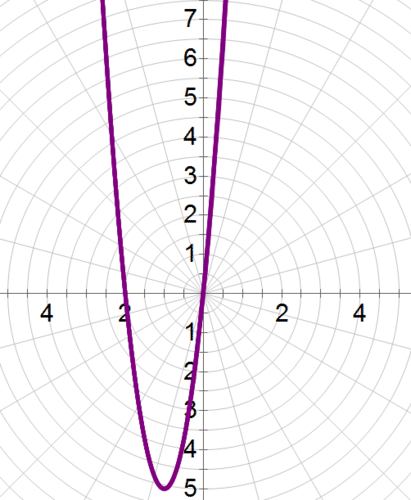
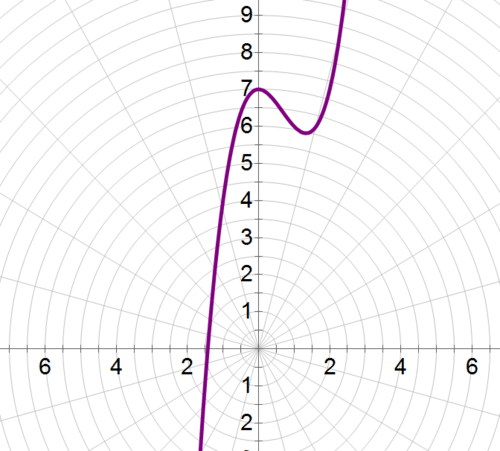
::例4Put the following equation into polar form, then graph it. .
::将以下方程式以极形形式显示,然后绘制图示。 y=x3- 2x2+7。Use the transformation formulas to put the equation in terms of and .
::使用变换公式将方程式以 r 和 + 表示 。
::y=3-2x2+7rsin(rcos)3-2(rcos)2+7rsinr3cos3}2r2cos2}7rsinr3cos3}2r2cos22r2cos27Now, graph.
::现在,图表。Example 5
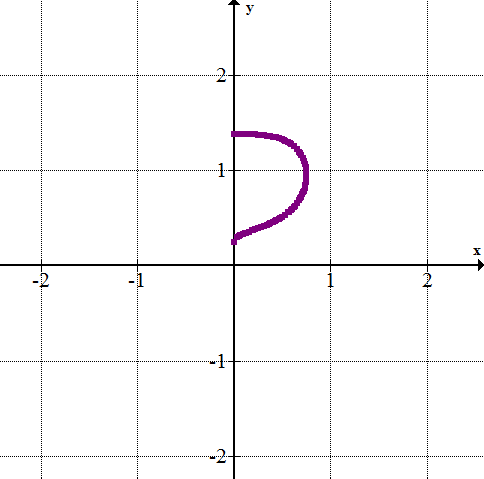
::例5Graph the following equation, then put it into rectangular form. .
::绘制以下方程图,然后将其放入矩形。 r3+r2sin4。Use substitutions to put the equation in terms of and .
::使用替代方程式将方程式以 x 和 y 表示 。
::r3+r2sin4r3+r2=4sinr(r2+1)=4sinr@r2(r2+1)=4rsin(x2+y2)(x2+y2+1)(x2+y2+1)=4y0=x4+2x2y2+x2+y4+y2+y2-4y4yReview
::回顾For #1-4, convert the point given in rectangular form to a point in polar form. Be careful when calculating .
::对于 # 1 4, 将矩形形式的点转换为极形的点。 当计算 \ 时要小心 。- (2, 3)
- (-3, 4)
- (5, 12)
- (-6, -8)
For #5-8, convert the point given in polar form to a point in rectangular form.
::对于# 5-8, 将以极形表示的点转换为矩形表示的点 。For #9-11, put the equation in rectangular form into polar form and graph.
::在# 9- 11, 将矩形方程式以矩形形式设置为极形和图示 。-
::y=3x+1 y=3x+1 -
::y=x2+2 y=x2+2 -
:
For #12-16, put the equation in polar form into rectangular form and graph.
::对于#12-16,将极形方程设置成矩形形和图形。-
::r=2sec -
::r=1 -
:: -
::r=104+21sin2 {___________________________________________________________________________________________________________________________________________________________________________________________________________________________________________________________________________________
Review (Answers)
::回顾(答复)Click to see the answer key or go to the Table of Contents and click on the Answer Key under the 'Other Versions' option.
::单击可查看答题键, 或转到目录中, 单击“ 其他版本” 选项下的答题键 。