2.2 供应和需求
章节大纲
-
Supply and Demand
::供应和需求Supply and demand affect prices in the market by interacting with one another. Supply is defined as the amount of a product that will be offered for sale at all the possible prices in the market. For this reason, supply is considered to be from the producer or seller’s point of view. More will be offered for sale at higher prices, and less will be offered for sale at lower prices, which is known as the Law of Supply. When a consumer enters into the marketplace, it is essential that he or she knows that the supplier is in business to make a profit, and even though there may be many products available to purchase, it is the informed consumer who gets the best value for his money. Changes in supply can be caused by several factors, including the cost of inputs, productivity, new technology, taxes, subsidies, expectations, government regulations, and the number of sellers in the market.
::供求关系通过互动影响市场价格。 供货被定义为以市场各种可能价格出售的产品的数量。 因此,供货被视为来自生产者或卖方的观点。 更多的供货将以更高的价格出售,更少的以较低的价格出售,即所谓的《供货法》。 当消费者进入市场时,他或她必须知道供货商正在经营中以盈利为目的,即使有许多产品可以购买,但知情的消费者也能得到其货币的最大价值。 供货的变化可能有几个因素,包括投入成本、生产率、新技术、税收、补贴、预期、政府条例和市场上卖主的数量。Universal Generalizations
::普遍化-
The interaction between supply, demand, and price is illustrated by supply and demand graphs.
::供应、需求和价格之间的相互作用通过供需图表加以说明。
Guiding Questions
::问 问 问 问 问 问 问 问 问 问 问 问 问 问 问 问 问 问 问 问 问 问 问 问 问 问 问 问 问 问 问 问 问 问 问 问 问 问 问 问 问 问 问 问 问 问 问 问 问 问 问 问 问 问 问 问 问 问 问 问 问 问 问 问 问 问 问 问 问 问 问 问 问 问 问 问 问 问 问 问 问 问 问 问 问 问 问 问 问 问 问 问 问 问 问 问 问 问-
How are the laws of supply and demand similar? How are they different?
::供需法则如何相似?它们有何不同? -
How do businesses react to changes in prices?
::企业如何对价格变化作出反应?
Before reading more about supply and demand, view the two introductory videos below by economics teacher Jacob Clifford.
::在阅读更多关于供求的影片之前,Video: An Introduction to Demand
::录像:需求简介Video: An Introduction to Supply
::录像:供应简介All suppliers of economic products must decide how much to offer for sale at various prices, which is a decision made according to what is best for that individual seller. What is best depends on the cost of producing those goods and services. On the other hand, you as a consumer must determine what is best for you and how much you are willing to pay to acquire those goods and services.
::所有经济产品供应商都必须决定以不同价格提供多少供销,这是根据对个体卖方的最佳利益做出的决定,最取决于生产这些商品和服务的成本。 另一方面,作为消费者,你必须决定什么最适合你,以及你愿意付出多少钱来购买这些商品和服务。Supply of Goods and Services
::商品和服务供应及服务When economists talk about supply, they mean the amount of some good or service a producer is willing to supply at each price. Price is what the producer receives for selling one unit of a good or service. A rise in price almost always leads to an increase in the quantity supplied of that good or service, while a fall in price will decrease the quantity supplied. When the price of gasoline rises, for example, it encourages profit-seeking firms to take several actions: expand exploration for oil reserves; drill for more oil; invest in more pipelines and oil tankers to bring the oil to plants where it can be refined into gasoline; build new oil refineries; purchase additional pipelines and trucks to ship the gasoline to gas stations; and open more gas stations or keep existing gas stations open longer hours. Economists call this positive relationship between price and quantity supplied—that a higher price leads to a higher quantity supplied and a lower price leads to a lower quantity supplied—the law of supply. The law of supply assumes that all other variables that affect supply are held constant.
::当经济学家谈论供应时,它们意味着生产者愿意以每价供应某种货物或服务的数量。价格是生产者出售一种货物或服务单位所得的价格。价格的上涨几乎总是导致该货物或服务供应量的增加,而价格的下跌则会减少供应量。例如,当汽油价格上涨时,它鼓励追求利润的公司采取若干行动:扩大石油储备勘探;钻探更多的石油;投资更多的管道和油轮,将石油运到可以炼制成汽油的工厂;建造新的炼油厂;购买更多的输油管道和卡车将汽油运到加油站;开设更多的加油站或保持现有加油站的营业时间更长。经济学家称,价格和供应量之间的这种积极关系是,高价格导致供应量增加,价格降低导致供应量下降。供应法假定影响供应的所有其他变数保持不变。Supply vs. Quantity Supplied
::供应量与供应量与供应量A supply schedule is a table that shows the quantity supplied at different prices in the market. A supply curve shows the relationship between quantity supplied and price on a graph. The law of supply says that a higher price typically leads to a higher quantity supplied.
::供应时间表是一个表格,显示以不同价格在市场上供应的数量。一个供应曲线显示供应数量与图表价格之间的关系。供应法规定,较高的价格通常会导致供应数量增加。In economic terminology, supply is not the same as quantity supplied. When economists refer to supply, they mean the relationship between a range of prices and the quantities supplied at those prices, a relationship that can be illustrated with a supply curve or a supply schedule. When economists refer to quantity supplied , they mean only a certain point on the supply curve, or one quantity on the supply schedule. In short, supply refers to the curve and quantity supplied refers to the (specific) point on the curve.
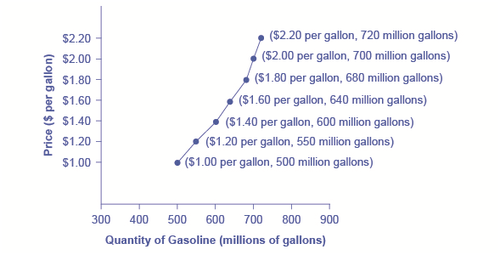
::在经济术语中,供应与供应数量不同。当经济学家提到供应时,它们指的是一系列价格与以这些价格供应的数量之间的关系,这种关系可以用供应曲线或供应时间表来说明。当经济学家提到供应数量时,它们只指供应曲线上的某一点,或供应时间表上的某一数量。简言之,供应是指所供应的曲线和数量指曲线上的(具体)点。[ 1] illustrates the law of supply, again using the market for gasoline as an example. Like demand, supply can be illustrated using a table or a graph. A supply schedule is a table, like [ ] , that shows the quantity supplied at a range of different prices. Again, price is measured in dollars per gallon of gasoline and quantity demanded is measured in millions of gallons. A supply curve is a graphic illustration of the relationship between price, shown on the vertical axis, and quantity, shown on the horizontal axis. The supply schedule and the supply curve are just two different ways of showing the same information. Notice that the horizontal and vertical axes on the graph for the supply curve are the same as for the demand curve.
::以供应法为例,再次以汽油市场为例。与需求一样,供应量可以用表格或图表来说明。供应时间表是一个表格,与[]一样,显示以不同价格提供的数量。同样,价格以每加仑汽油美元计量,所需数量以百万加仑计量。供应曲线是垂直轴上显示的价格与水平轴上显示的数量之间关系的图形说明。供应时间表和供应曲线只是显示相同信息的两种不同方式。注意供应曲线图上的水平轴和垂直轴与需求曲线相同。A Supply Curve for Gasoline
::汽油供应曲线The supply schedule is the table that shows quantity supplied of gasoline at each price. As the price rises, quantity supplied also increases and vice versa. The supply curve (S) is created by graphing the points from the supply schedule and then connecting them. The upward slope of the supply curve illustrates the law of supply—that a higher price leads to a higher quantity supplied, and vice versa.
Price and Supply of Gasoline (Supply Schedule)
::汽油价格和供应(供应附表)Price (per gallon)
::价格(每加仑)Quantity Supplied (millions of gallons)
::供应数量(百万加仑)$1.00
500
$1.20
550
$1.40
600
$1.60
640
$1.80
680
$2.00
700
$2.20
720
The shape of supply curves will vary somewhat according to the product: steeper, flatter, straighter, or curved. Nearly all supply curves, however, share a basic similarity: they slope up from left to right and illustrate the law of supply: as the price rises, say, from $1.00 per gallon to $2.20 per gallon, the quantity supplied increases from 500 gallons to 720 gallons. Conversely, as the price falls, the quantity supplied decreases.
::供应曲线的形状会因产品而有所不同:陡峭、平坦、直线或弯曲。但几乎所有供应曲线都具有基本相似性:它们从左向右倾斜,并说明了供应法则:例如,价格从每加仑1.0美元上涨到每加仑2.20美元,供应量从500加仑增加到720加仑。相反,随着价格下跌,供应量下降。Law of Demand
::需求法The law of demand states that, if all other factors remain equal, the higher the price of a good, the less people will demand that good. In other words, the higher the price, the lower the quantity demanded. The amount of a good that buyers purchase at a higher price is less because as the price of a good goes up, so does the opportunity cost of buying that good. As a result, people will naturally avoid buying a product that will force them to forgo the consumption of something else they value more.
::需求法规定,如果所有其他因素都持平,那么商品的价格越高,人们对商品的需求就越低。 换句话说,价格越高,要求的数量就越低。 买家以更高价格购买的商品的金额越低,因为随着商品的价格上升,购买商品的机会成本也随之上升。 因此,人们自然会避免购买会迫使他们放弃消费他们更珍视的东西的产品。Video: Demand vs. Supply
::视频:需求与供应Demand refers to how much (quantity) of a product or service is desired by buyers. The quantity demanded is the amount of a product people are willing to buy at a certain price; the relationship between price and quantity demanded is known as the demand relationship.
::需求是指买方希望获得多少产品或服务(数量),要求的数量是产品人愿意以一定价格购买的数量;价格与需求数量之间的关系称为需求关系。Other Factors That Affect Supply
::影响供应的其他因素In the example above, we saw that changes in the prices of inputs in the production process will affect the cost of production and thus the supply. Changes in supply are affected by the cost of inputs, productivity, technology, taxes and subsidies, expectations, and the number of sellers. In addition, the cost of production may be affected by changes in weather or other natural conditions, natural disasters, and some governmental policies.
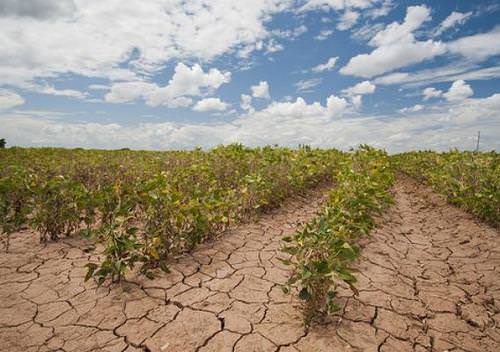
::在上述例子中,我们看到生产过程中投入物价格的变化将影响生产成本,从而影响供应,供应量的变化会受到投入物成本、生产率、技术、税收和补贴、预期和销售商数量的影响,此外,生产成本也会受到天气或其他自然条件的变化、自然灾害和一些政府政策的影响。The cost of production for many agricultural products will be affected by changes in natural conditions. For example, the area of northern China which typically grows about 60% of the country’s wheat output experienced its worst drought in at least 50 years in the second half of 2009. A drought decreases the supply of agricultural products, which means that at any given price, a lower quantity will be supplied; conversely, especially good weather would shift the supply curve to the right.
::许多农产品的生产成本将受到自然条件变化的影响。 比如,2009年下半年至少50年来,中国小麦产量增长60%左右的中国北部地区经历了最严重的干旱。 干旱减少了农产品的供应,这意味着以任何特定价格供应的产量都将降低;相反,特别是良好的天气会将供应曲线向右转变。Natural conditions, like drought, are one factor that can affect the supply of agricultural goods, like the Texas soybean crop pictured here.
::自然条件,如干旱,是可能影响农产品供应的一个因素,如这里所描绘的得克萨斯大豆作物。When a firm discovers a new technology that allows the firm to produce at a lower cost, the supply curve will shift to the right, as well. For instance, in the 1960s a major scientific effort nicknamed the Green Revolution focused on breeding improved seeds for basic crops like wheat and rice. By the early 1990s, more than two-thirds of the wheat and rice in low-income countries around the world was grown with these Green Revolution seeds—and the harvest was twice as high per acre. A technological improvement that reduces costs of production will shift supply to the right, so that a greater quantity will be produced at any given price.
::当一家公司发现新技术让公司以较低成本生产时,供应曲线也会向右转移。 比如,1960年代,一项称为绿色革命的重大科学努力 — — 绿色革命(Green Revolution),其重点是为小麦和大米等基本作物培育改良种子。 到1990年代初,全世界低收入国家三分之二以上的小麦和大米都是用绿色革命种子种植的 — — 收获是每英亩产量的两倍。 降低生产成本的技术改进将把供应转向右,从而以任何特定价格生产更多的粮食。Government policies can affect the cost of production and the supply curve through taxes, regulations, and subsidies. For example, the U.S. government imposes a tax on alcoholic beverages that collects about $8 billion per year from producers. Taxes are treated as costs by businesses. Higher costs decrease supply for the reasons discussed above. Other examples of policy that can affect cost are the wide array of government regulations that require firms to spend money to provide a cleaner environment or a safer workplace; complying with regulations increases costs.
::政府政策可以通过税收、条例和补贴影响生产成本和供应曲线。 比如,美国政府对酒精饮料征收税收,每年从生产者那里征收80亿美元左右的税收;企业将税收作为成本处理;由于上述原因,更高的成本降低了供应量;影响成本的其他政策实例包括要求企业花费大量资金提供更清洁的环境或更安全的工作场所的政府条例;遵守法规提高成本。A government subsidy, on the other hand, is the opposite of a tax. A subsidy occurs when the government pays a firm directly or reduces the firm’s taxes if the firm carries out certain actions. From the firm’s perspective, taxes or regulations are an additional cost of production that shifts supply to the left, leading the firm to produce a lower quantity at every given price. Government subsidies reduce the cost of production and increase supply at every given price, shifting supply to the right.
::另一方面,政府补贴与税收截然相反。 当政府直接支付公司或降低公司税时,如果公司采取某些行动,补贴就会发生。 从企业的角度来看,税收或监管是额外的生产成本,将供应转向左翼,导致公司以每定价格生产较低数量。 政府补贴会降低生产成本,以每定价格增加供应,将供应转向右翼。- Video: Should the Government Subsidize... Silly Walks? (A Ridiculous Example of a Subsidy)
Shift in Supply
::供应变动We know that a supply curve shows the minimum price a firm will accept to produce a given quantity of output. What happens to the supply curve when the cost of production goes up? Following is an example of a shift in supply due to a production cost increase.
::我们知道,供应曲线显示了生产一定数量产出的公司将接受的最低价格。 当生产成本上升时,供应曲线会怎样? 下面是生产成本上涨导致供应变化的例子。Step 1. Draw a graph of a supply curve for pizza. Pick a quantity (like Q 0 ). If you draw a vertical line up from Q 0 to the supply curve, you will see the price the firm chooses. An example is shown in [ 2] .
::步骤1. 为披萨绘制一个供应曲线图。选择一个数量(类似 Q0 ) 。如果从 Q0 向上划一条垂直线到 供应曲线,您将看到公司选择的价格。示例见 [2] 。- Supply Curve
The supply curve can be used to show the minimum price a firm will accept to produce a given quantity of output.
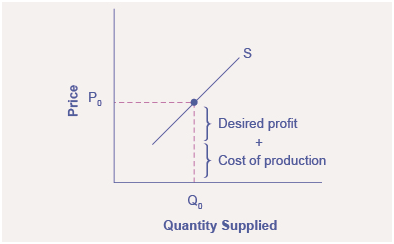
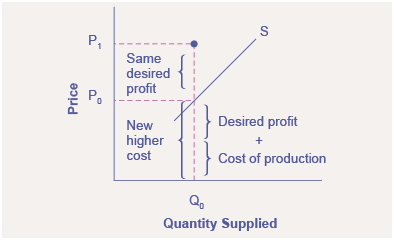
::供应曲线可用来显示生产一定数量产出的公司愿意接受的最低价格。Step 2. Why did the firm choose that price and not some other? One way to think about this is that the price is composed of two parts. The first part is the average cost of production, in this case, the cost of the pizza ingredients (dough, sauce, cheese, pepperoni, and so on), the cost of the pizza oven, the rent for the shop, and the wages of the workers. The second part is the firm’s desired profit, which is determined, among other factors, by the profit margins in that particular business. If you add these two parts together, you get the price the firm wishes to charge. The quantity Q0 and associated price P0 give you one point on the firm’s supply curve, as shown in [ 3] .
::第二步,为什么公司选择这个价格而不是其他价格?一个思考的方法是价格由两部分组成。第一部分是平均生产成本,在这种情况下,是披萨成分的成本(面粉、酱、奶酪、辣椒尼等)、披萨烤箱的成本、商店的租金和工人的工资。第二部分是公司想要的利润,除其他因素外,这取决于该行业的利润幅度。如果将这两部分加在一起,你就会得到公司想要收取的价格。数量 Q0和相关的价格P0给了你公司供应曲线上的一个点,如 [3] 所示。- Setting Prices
The cost of production and the desired profit equal the price a firm will set for a product.
::生产成本和预期利润等于公司为产品确定的价格。Step 3. Now, suppose that the cost of production goes up. Perhaps cheese has become more expensive by $0.75 per pizza. If that is true, the firm will want to raise its price by the amount of the increase in cost ($0.75). Draw this point on the supply curve directly above the initial point on the curve, but $0.75 higher, as shown in [ 4] .
::第3步,假设生产成本上升,也许奶酪价格每比萨饼0.75美元,价格会提高,如果确实如此,公司将希望提高价格,增加成本(0.75美元),在供应曲线的最初点上方直接划出这一点,但如[4]所示,增加0.75美元。- Increasing Costs Leads to Increasing Price
Because the cost of production and the desired profit equals the price a firm will set for a product, if the cost of production increases, the price for the product will also need to increase.
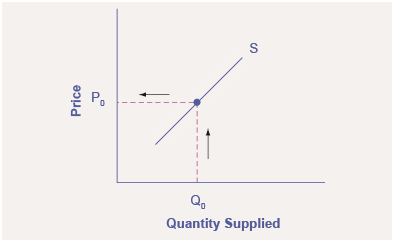
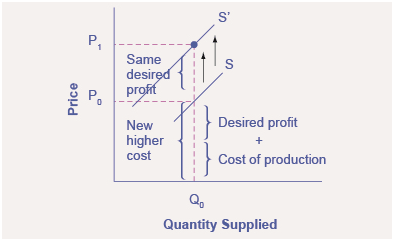
::由于生产成本和预期利润等于公司为产品确定的价格,如果生产成本增加,产品价格也需要提高。Step 4. Shift the supply curve through this point. You will see that an increase in cost causes an upward (or a leftward) shift of the supply curve so that at any price, the quantities supplied will be smaller, as shown in [ 5] .
::第4步 将供应曲线移到此点。您可以看到,成本上升导致供应曲线向上(或向左)移动,这样,无论以何种价格计算,供应量都将较小,如 [5] 所示。- Supply Curve Shifts
When the cost of production increases, the supply curve shifts upwardly to a new price level.
::当生产成本上升时,供应曲线向上转向新的价格水平。Calculating the Price Elasticity of Supply
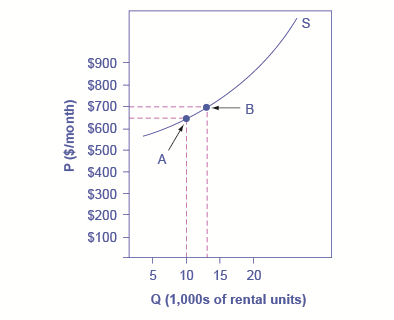
::计算供应价格弹性Assume that an apartment rents for $650 per month and at that price 10,000 units are rented as shown in [ 6] . When the price increases to $700 per month, 13,000 units are supplied into the market. By what percentage does apartment supply increase? What is the price sensitivity?
::假设公寓租金每月650美元,并按[6] 所示价格租用10 000个单位。当价格上涨到每月700美元时,市场将供应13 000个单位。按百分比计算,公寓供应增加多少?价格敏感度是多少?- Price Elasticity of Supply
The price elasticity of supply is calculated as the percentage change in quantity divided by the percentage change in price.
::供应的价格弹性按数量的百分比变化除以价格的百分比变化计算。Price elasticity measures the responsiveness of the quantity demanded or supplied of a good to a change in its price. It is computed as the percentage change in quantity demanded (or supplied) divided by the percentage change in price. Elasticity can be described as elastic (or very responsive), unit elastic, or inelastic (not very responsive). Elastic demand or supply curves indicate that quantity demanded or supplied respond to price changes in a greater than proportional manner. An inelastic demand or supply curve is one where a given percentage change in price will cause a smaller percentage change in quantity demanded or supplied. A unitary elasticity means that a given percentage change in price leads to an equal percentage change in quantity demanded or supplied.
::价格弹性衡量要求或供应货物的数量对价格变化的响应性; 以所需(或供应)数量的百分比变化除以价格的百分比变化计算; 弹性可描述为弹性(或非常反应)、单位弹性或无弹性(不反应); 弹性需求或供应曲线表明,要求或供应的数量对价格变化的反应大于比例; 无弹性需求或供应曲线是指价格的某一百分比变化会导致所需或供应的数量的相同百分比变化。Summing Up Factors That Change Supply
::B. 总结变化供应因素Changes in the cost of inputs, natural disasters, new technologies, and the impact of government decisions all affect the cost of production. In turn, these factors affect how much firms are willing to supply at any given price.
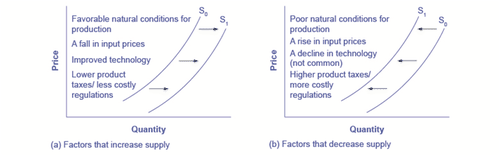
::投入成本的变化、自然灾害、新技术和政府决定的影响都影响到生产成本,反过来,这些因素又影响到企业愿意以任何特定价格提供多少。[ 7] summarizes factors that change the supply of goods and services. Notice that a change in the price of the product itself is not among the factors that shift the supply curve. Although a change in price of a good or service typically causes a change in quantity supplied or a movement along the supply curve for that specific good or service, it does not cause the supply curve itself to shift.
::注意产品价格的变动本身不是改变供应曲线的因素之一,虽然货物或服务价格的变动通常会导致供应数量的变化或该特定货物或服务的供应曲线的变动,但不会导致供应曲线本身的变动。- Factors That Shift Supply Curves
(a) A list of factors that can cause an increase in supply from S 0 to S 1 . (b) The same factors, if their direction is reversed, can cause a decrease in supply from S 0 to S 1 .
:a) 一份清单,列出可能导致供应从S0增加至S1的因素;(b) 同样的因素,如果方向逆转,可能导致供应从S0减少至S1。
Because demand and supply curves appear on a two-dimensional diagram with only price and quantity on the axes, an unwary visitor to the land of economics might be fooled into believing that economics is about only four topics: demand, supply, price, and quantity. However, demand and supply are really “umbrella” concepts: demand covers all the factors that affect demand, and supply covers all the factors that affect supply. Factors other than price that affect demand and supply are included by using shifts in the demand or the supply curve. In this way, the two-dimensional demand and supply model becomes a powerful tool for analyzing a wide range of economic circumstances.
::由于供求曲线出现在一个仅以价格和数量为轴心的二维图表上,因此对经济学地的不小心访问者可能会被骗为相信经济学只有四个主题:需求、供应、价格和数量;然而,供求其实是“伞状”概念:需求涵盖影响需求的所有因素,而供应则涵盖影响供应的所有因素;影响供需的其他因素不是价格,而是通过使用需求或供应曲线的变化而包括在内;这样,二维供求模式就成为分析广泛经济环境的有力工具。Long-Run vs. Short-Run Impact
::长跑对短跑影响Elasticities are often lower in the short run than in the long run. On the demand side of the market, it can sometimes be difficult to change Qd in the short run, but easier in the long run. Consumption of energy is a clear example. In the short run, it is not easy for a person to make substantial changes in their energy consumption. Maybe you can carpool to work sometimes or adjust your home thermostat by a few degrees if the cost of energy rises, but that is about all. However, in the long-run you can purchase a car that gets more miles to the gallon, choose a job that is closer to where you live, buy more energy-efficient home appliances, or install more insulation in your home. As a result, the elasticity of demand for energy is somewhat inelastic in the short run, but much more elastic in the long run.
::短期的弹性通常比长期的要低。 在市场的需求方面,有时很难在短期内改变QD,但从长远看则比较容易。能源消费是一个明显的例子。在短期内,一个人很难在能源消耗方面做出重大改变。也许你可以开车有时工作,或者在能源成本上升的情况下将家庭自动调温器调整几度。然而,从长期来看,你可以购买一辆离加仑更远的汽车,选择更靠近你住的地方的工作,购买更节能的家庭电器,或者在家中安装更多的隔热设备。结果,能源需求的弹性在短期内有些不弹性,但从长远看,弹性要大得多。[ 8] is an example, based roughly on historical experience, for the responsiveness of Qd to price changes. In 1973, the price of crude oil was $12 per barrel and total consumption in the U.S. economy was 17 million barrels per day. That year, the nations who were members of the Organization of Petroleum Exporting Countries (OPEC) cut off oil exports to the United States for six months because the Arab members of OPEC disagreed with the U.S. support for Israel. OPEC did not bring exports back to their earlier levels until 1975—a policy that can be interpreted as a shift of the supply curve to the left in the U.S. petroleum market. [ 8(a)] and [ 8(b)] show the same original equilibrium point and the same identical shift of a supply curve to the left from S 0 to S 1 .
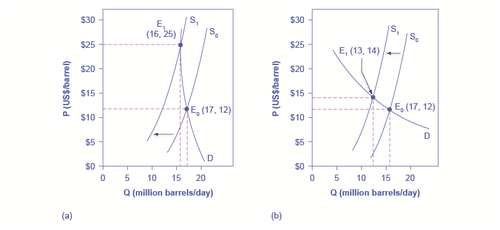
::1973年,原油价格为每桶12美元,美国经济的消费总量为每天1 700万桶。 当年,石油输出国组织(欧佩克)成员国因欧佩克的阿拉伯成员国不同意美国对以色列的支持而中断了对美国的石油出口6个月,欧佩克的阿拉伯成员国不同意美国对以色列的支持。欧佩克直到1975年才将出口恢复到原来的水平——这一政策可以解释为供应曲线向美国石油市场左端的转变。 [8(a)]和[8(b)]- How a Shift in Supply Can Affect Price or Quantity
The intersection (E 0 ) between demand curve D and supply curve S 0 is the same in both (a) and (b). The shift of supply to the left from S 0 to S 1 is identical in both (a) and (b). The new equilibrium (E 1 ) has a higher price and a lower quantity than the original equilibrium (E 0 ) in both (a) and (b). However, the shape of the demand curve D is different in (a) and (b). As a result, the shift in supply can result either in a new equilibrium with a much higher price and an only slightly smaller quantity, as in (a), or in a new equilibrium with only a small increase in price and a relatively larger reduction in quantity, as in (b).
::需求曲线D和供应曲线S0之间的交叉点(E0)在(a)和(b)两个方面相同。供应向左的转移在(a)和(b)两个方面相同。新的平衡(E1)的价格高于原平衡(E0),数量低于(a)和(b)两个方面原平衡(E0),但需求曲线D的形状在(a)和(b)两个方面不同。因此,供应的转移可能导致新的平衡,价格要高得多,数量要小一点,如(a)或(b)两个方面,价格小幅上涨,数量减少较多。[ 8(a)] shows inelastic demand for oil in the short run similar to that which existed for the United States in 1973. In [ 8(a)] , the new equilibrium (E 1 ) occurs at a price of $25 per barrel, roughly double the price before the OPEC shock, and an equilibrium quantity of 16 million barrels per day. [ (b)] shows what the outcome would have been if the U.S. demand for oil had been more elastic, a result more likely over the long term. This alternative equilibrium (E 1 ) would have resulted in a smaller price increase to $14 per barrel and larger reduction in equilibrium quantity to 13 million barrels per day. In 1983, for example, U.S. petroleum consumption was 15.3 million barrels a day, which was lower than in 1973 or 1975. U.S. petroleum consumption was down even though the U.S. economy was about one-fourth larger in 1983 than it had been in 1973. The primary reason for the lower quantity was that higher energy prices spurred conservation efforts, and after a decade of home insulation, more fuel-efficient cars, more efficient appliances and machinery, and other fuel-conserving choices, the demand curve for energy had become more elastic.
::在[8(a)]中,新的平衡(E1)以每桶25美元的价格出现,大约是欧佩克冲击前价格的两倍,平均数量为每天1,600万桶。 [(b)]表明如果美国对石油的需求比1973年大四分之一,那么结果会如何,从长远看,这种替代平衡(E1)将会导致价格小幅上扬,达到每桶14美元,平衡数量将更大幅度地减少到每天1,300万桶。 例如,1983年,美国石油消费为每天1,530万桶,低于1973年或1975年的水平。 尽管美国1983年的石油消费比1973年大约高出四分之一,但美国1983年的石油消费却有所下降。 数量下降的主要原因是,能源价格提高刺激了节能努力,而且经过十年的住宅隔热、燃料效率更高的汽车、效率更高的电器和机械以及其他燃料节约选择之后,能源需求也呈曲线。On the supply side of markets, producers of goods and services typically find it easier to expand production in the long term of several years rather than in the short run of a few months. After all, in the short run it can be costly or difficult to build a new factory, hire many new workers, or open new stores. But over a few years, all of these are possible.
::在市场供给方面,商品和服务的生产者通常会发现长期扩大生产比短期增加几个月更容易。 毕竟,在短期内,建造新工厂、雇用许多新工人或开设新商店的成本或难度都可能很高或难以。 但几年后,所有这些都有可能。Indeed, in most markets for goods and services, prices bounce up and down more than quantities in the short run, but quantities often move more than prices in the long run. The underlying reason for this pattern is that supply and demand are often inelastic in the short run, so that shifts in either demand or supply can cause a relatively greater change in prices. But since supply and demand are more elastic in the long run, the long-run movements in prices are more muted, while quantity adjusts more easily in the long run.
::事实上,在大多数商品和服务市场中,短期内价格的回升和下跌超过数量,但从长远看,价格的回升往往超过价格。 造成这种模式的根本原因是供求关系在短期内往往没有弹性,因此需求或供应的转变都会导致价格的相对更大变化。 但是,由于供求关系从长远看更具弹性,长期价格的波动更加平缓,而从长远看,数量调整则更加容易。Further Reading
::继续阅读Consider how supply and demand factor in to the production of automobiles in these two news articles:
::考虑这两篇新闻文章中汽车生产的供需因素如何:Answer the self check questions below to monitor your understanding of the concepts in this section.
::回答下面的自我核对问题,以监测你对本节概念的理解。Self Check Questions
::自查问题1. What does the Law of Supply state? Do you believe this idea to be true? Why or why not?
::1. " 供应国法 " 是什么?你是否认为这一想法是真实的?为什么或为什么不是?2. How does the seller/supplier determine how much to charge for a product? What factors must he/she take into account?
::2. 卖方/供应商如何确定产品收费多少?他/她必须考虑哪些因素?3. How does the Law of Supply differ from the Law of Demand?
::3. 《供应法》与《需求法》有何不同?4. How else can a supply schedule be presented?
::4. 如何提出供应时间表?5. How can the Law of Supply apply to you, as a form of "labor"? What are you willing to do for a higher wage?
::5. 《供应法》如何适用于你,作为一种 " 实验室 " 的形式?6. What does the market supply curve show?
::6. 市场供应曲线显示什么?7. Explain the difference between a supply curve and a market supply curve.
::7. 解释供应曲线和市场供应曲线之间的差异。8. What does a change in quantity supplied respond to?
::8. 供应量的变化有何反应?9. There are 7 factors that may cause a change in supply. List each one and give an example of how these changes impact supply.
::9. 有7个因素可能导致供应变化,每个列出一个,并举例说明这些变化如何影响供应。10. Supply elasticity responds to a change in price. Explain the 3 types of supply elasticity and price changes. How can a business determine its supply elasticity?
::10. 供应弹性因应价格变化,解释三种供应弹性和价格变化:企业如何确定其供应弹性? -
The interaction between supply, demand, and price is illustrated by supply and demand graphs.