2.3 工作价格制度
章节大纲
-
The Price System at Work
::工作价格制度Prices are considered to be neutral because they do not favor either the producer or the consumer. Prices are flexible when an unforeseen event, such as war, occurs. Prices will be adjusted to meet the unexpected situation and then over time, may return to previous levels. Prices are considered efficient because they are based on supply and demand; there is no need for a bureaucracy to create them. Finally, prices are easy to understand. From the time that we are old enough to buy something, we are familiar with how prices work in the market place.
::价格被认为是中性的,因为它们既不利于生产者,也不利于消费者。 价格在发生战争等意外事件时是灵活的。 价格将进行调整,以适应意外情况,然后随着时间推移,可能恢复到以前的水平。 价格被认为是有效的,因为它们基于供求;不需要官僚机构来创造价格。 最后,价格是很容易理解的。 从我们老到可以买东西的时候,我们便熟悉市场价格是如何运作的。Because of supply and demand in the free market economy, there are various prices that may prevail. A change in price in one market may affect the allocation of resources in that market, as well as between markets. We know this is how the market economy works because economists use economic models to help analyze behavior and predict outcomes. These types of models can help determine why there may be a surplus or a shortage in the market. In addition, economists use theories to help create what would be ideal conditions and outcomes, in order to measure the performance of the market or other types of economic systems.
::由于自由市场经济的供求关系,可能存在多种价格。一个市场的价格变化可能影响该市场以及市场之间的资源分配。我们知道市场经济是如何运作的,因为经济学家使用经济模型来帮助分析行为和预测结果。这些模型可以帮助确定市场为什么会出现盈余或短缺。此外,经济学家利用理论帮助创造理想的条件和结果,以衡量市场或其他类型的经济体系的业绩。Universal Generalizations
::普遍化-
Changes in supply and demand cause prices to change.
::供需变化导致价格变化。 -
The interaction between supply, demand, and price is illustrated by supply and demand graphs.
::供应、需求和价格之间的相互作用通过供需图表加以说明。 -
The interaction between supply, demand, and non-price determinants is illustrated by supply and demand graphs.
::供需图表说明了供需决定因素与非价格决定因素之间的相互作用。 -
Economists use market models to predict how events impact possible changes in price.
::经济学家利用市场模型预测事件如何影响价格的可能变化。
Guiding Questions
::问 问 问 问 问 问 问 问 问 问 问 问 问 问 问 问 问 问 问 问 问 问 问 问 问 问 问 问 问 问 问 问 问 问 问 问 问 问 问 问 问 问 问 问 问 问 问 问 问 问 问 问 问 问 问 问 问 问 问 问 问 问 问 问 问 问 问 问 问 问 问 问 问 问 问 问 问 问 问 问 问 问 问 问 问 问 问 问 问 问 问 问 问 问 问 问 问 问-
How are prices determined in a competitive market?
::价格如何在竞争激烈的市场中决定? -
How can economic models be used to predict and explain changes in price?
::如何利用经济模型预测和解释价格变化? -
Why is price elasticity important?
::为什么价格弹性很重要?
Video: Supply, Demand, Equilibrium, and Shifting Curves (Indiana Jones)
::视频:供应、需求、平衡和转变曲线(印度琼斯)Equilibrium—Where Demand and Supply Intersect
::平衡-供求交叉之处Because the graphs for demand and supply curves both have price on the vertical axis and quantity on the horizontal axis, the demand curve and supply curve for a particular good or service can appear on the same graph. Together, demand and supply determine the price and the quantity that will be bought and sold in a market.
::由于供需曲线的图表在垂直轴上都有价格,在横向轴上也有数量,因此特定货物或服务的需求曲线和供应曲线可以出现在同一图表上。 供需关系共同决定了在市场上买卖的价格和数量。[ 1] illustrates the interaction of demand and supply in the market for gasoline. The demand curve (D), the supply curve (S), and [ 1] contains the same information in tabular form.
::[1] 说明汽油市场供求的相互作用,需求曲线(D)、供应曲线(S)和[1]以表格形式载有同样的信息。Demand and Supply for Gasoline
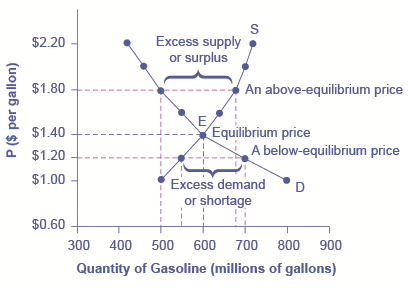
::汽油的需求和供应The demand curve (D) and the supply curve (S) intersect at the equilibrium point E, with a price of $1.40 and a quantity of 600. The equilibrium is the only price where quantity demanded is equal to quantity supplied. At a price above equilibrium like $1.80, quantity supplied exceeds the quantity demanded, so there is excess supply. At a price below equilibrium such as $1.20, quantity demanded exceeds quantity supplied, so there is excess demand.
::需求曲线(D)和供应曲线(S)在E平衡点交叉,价格为1.40美元,数量为600美元。平衡是要求数量与供应数量相等的唯一价格。以超过180美元等的平衡价格,供应数量超过要求的数量,因此供应过剩。以低于平衡的价格,如1.20美元,要求数量超过供应数量,因此需求过剩。Price, Quantity Demanded, and Quantity Supplied
::价格、需求量和供应量Price (per gallon)
::价格(每加仑)Quantity demanded (millions of gallons)
::所需数量(百万加仑)Quantity supplied (millions of gallons)
::供应数量(百万加仑)$1.00
800
500
$1.20
700
550
$1.40
600
600
$1.60
550
640
$1.80
500
680
$2.00
460
700
$2.20
420
720
Remember this: When two lines on a diagram cross, this intersection usually means something. The point where the supply curve (S) and the demand curve (D) cross, designated by point E in [ 1] , is called the equilibrium. The equilibrium price is the only price where the plans of consumers and the plans of producers agree—that is, where the amount of the product consumers want to buy (quantity demanded) is equal to the amount producers want to sell (quantity supplied). This common quantity is called the equilibrium quantity . At any other price, the quantity demanded does not equal the quantity supplied, so the market is not in equilibrium at that price.
::记住这一点: 当图表十字路口上有两个行时, 此交叉点通常意味着某种东西。 供应曲线( S) 和需求曲线( D) 交叉点( 由E点在 [ 1] 中指定) 被称为平衡。 平衡价格是消费者计划和生产者计划达成一致的唯一价格, 即消费者想要购买的数量( 要求的数量) 等于生产者想要出售的数量( 提供的数量 ) 。 这个共同数量被称为平衡数量 。 在任何其他价格中, 要求的数量并不等于所供应的数量, 因此市场无法以该价格保持平衡 。In [ 1] , the equilibrium price is $1.40 per gallon of gasoline and the equilibrium quantity is 600 million gallons. If you had only the demand and supply schedules, and not the graph, you could find the equilibrium by looking for the price level on the tables where the quantity demanded and the quantity supplied are equal.
::在[1]中,平衡价格为每加仑汽油1.40美元,平衡数量为6亿加仑。如果只有供需时间表,而不是图表,您可以通过在所需数量和供应数量相等的表格中寻找价格水平找到平衡。The word “equilibrium” means “balance.” If a market is at its equilibrium price and quantity, then it has no reason to move away from that point. However, if a market is not at equilibrium, then economic pressures arise to move the market toward the equilibrium price and the equilibrium quantity.
::“平衡”一词意指“平衡 ” 。 如果市场处于平衡价格和数量水平,那么它就没有理由偏离这一点。 但是,如果市场不处于平衡状态,那么经济压力就会产生,以将市场转向平衡价格和平衡数量。Imagine, for example, that the price of a gallon of gasoline was above the equilibrium price—that is, instead of $1.40 per gallon, the price is $1.80 per gallon. This above-equilibrium price is illustrated by the dashed horizontal line at the price of $1.80 in [ 1] . At this higher price, the quantity demanded drops from 600 to 500. This decline in quantity reflects how consumers react to the higher price by finding ways to use less gasoline.
::例如,想象一下,一加仑汽油的价格高于平衡价格,也就是说,价格为每加仑1.40美元,而不是每加仑1.40美元,高于平衡价格为每加仑1.8美元,这一高于平衡价格的例证是水平线破折,价格在[1] 中为1.80美元,在这样高的价格下,要求的数量从600下降到500美元。 数量下降反映了消费者如何通过寻找减少汽油的方法对更高的价格作出反应。Additionally , at this higher price of $1.80, the quantity of gasoline supplied rises from the 600 to 680, as the higher price makes it more profitable for gasoline producers to expand their output. Now, consider how quantity demanded and quantity supplied are related at this above-equilibrium price. Quantity demanded has fallen to 500 gallons, while quantity supplied has risen to 680 gallons. In fact, at any above-equilibrium price, the quantity supplied exceeds the quantity demanded. We call this an excess supply or a surplus .
::此外,以180美元这一更高的价格,汽油供应量从600加仑增加到680加仑,因为价格的提高使汽油生产商增加产量更有利可图。现在,考虑以这种平衡价格要求的数量和供应的数量如何相关。 所需数量已降至500加仑,而供应的数量已上升到680加仑。 事实上,以任何高于平衡的价格,供应的数量都超过了要求的数量。 我们称之为超额供应或盈余。With a surplus, gasoline accumulates at gas stations, in tanker trucks, in pipelines, and at oil refineries. This accumulation puts pressure on gasoline sellers. If a surplus remains unsold, those firms involved in making and selling gasoline are not receiving enough cash to pay their workers and to cover their expenses. In this situation, some producers and sellers will want to cut prices, because it is better to sell at a lower price than not to sell at all. Once some sellers start cutting prices, others will follow to avoid losing sales. These price reductions in turn will stimulate a higher quantity demanded. So, if the price is above the equilibrium level, incentives built into the structure of demand and supply will create pressures for the price to fall toward the equilibrium.
::汽油在加油站、油罐车、管道和炼油厂积累,汽油在汽油厂、油罐车、管道和炼油厂积累。这种积累给汽油销售商带来了压力。如果剩余汽油仍未出售,那些从事汽油制造和销售的公司就得不到足够的现金来支付工人并支付其开支。在这种情况下,一些生产商和卖主会希望降低价格,因为价格比不出售要低得多。一旦一些卖主开始削减价格,其他卖主就会随之而来,以避免销售损失。这些价格的减少反过来又会刺激更高的数量。因此,如果价格高于平衡水平,那么在供求结构中设定的刺激因素将产生价格向均衡下跌的压力。Now suppose that the price is below its equilibrium level at $1.20 per gallon, as the dashed horizontal line at this price in [ 1] shows. At this lower price, the quantity demanded increases from 600 to 700 as drivers take longer trips, spend more minutes warming up the car in the driveway in wintertime, stop sharing rides to work, and buy larger cars that get fewer miles to the gallon. However, the below-equilibrium price reduces gasoline producers’ incentives to produce and sell gasoline, and the quantity supplied falls from 600 to 550.
::现在假设价格低于每加仑1.20美元的平衡水平,正如[ 1]中以这一价格折叠的横向线所显示的那样。 在这一较低的价格下,数量要求从600增加到700,因为司机旅行时间更长,冬季在车道上花费更多分钟加热汽车,停止搭车工作,购买更大的汽车,离加仑的里程更少。 然而,低于平衡的价格降低了汽油生产者生产和销售汽油的动力,供应量从600下降到550。When the price is below equilibrium, there is excess demand, or a shortage —that is, at the given price the quantity demanded, which has been stimulated by the lower price, now exceeds the quantity supplied, which had been depressed by the lower price. In this situation, eager gasoline buyers mob the gas stations, only to find many stations running short of fuel. Oil companies and gas stations recognize that they have an opportunity to make higher profits by selling what gasoline they have at a higher price. As a result, the price rises toward the equilibrium level.
::当价格低于平衡时,就会出现需求过剩或短缺,即需求量因价格低而提高,现在超过供应量,而供应量因价格低而减少。 在这种情况下,热心的汽油购买者将加油站聚集起来,发现许多加油站燃料短缺。 石油公司和加油站认识到,它们有机会以更高的价格出售汽油,从而获得更高的利润。 结果,价格向平衡水平上升。Changes in Equilibrium Price and Quantity: The Four-Step Process
::平衡价格和数量的变化:四步进程Let’s begin this discussion with a single economic event. It might be an event that affects demand, like a change in income, population, tastes, prices of substitutes or complements, or expectations about future prices. It might be an event that affects supply, like a change in natural conditions, input prices, or technology, or government policies that affect production. How does this economic event affect equilibrium price and quantity? We will analyze this question using a four-step process.
::让我们从一个单一的经济事件开始讨论。 这可能是一个影响需求的事件,比如收入、人口、口味、替代物或补充物价格或未来价格预期的变化。 这可能是一个影响供给的事件,比如自然条件、投入物价格或技术或影响生产的政府政策的变化。 这一经济事件如何影响平衡价格和数量? 我们将用四步进程分析这一问题。Step 1.
::1. 步骤1。Draw a demand and supply model before the economic change took place. To establish the model requires four standard pieces of information: The law of demand, which tells us the slope of the demand curve; the law of supply, which gives us the slope of the supply curve; the shift variables for demand; and the shift variables for supply. From this model, find the initial equilibrium values for price and quantity.
::在经济变化发生之前绘制供需模式。 建立该模式需要四种标准信息: 需求法,它告诉我们需求曲线的斜度; 供应法,它给我们提供了供应曲线的斜度; 需求的变化变量; 以及供应的转变变量。 从这个模型中找到价格和数量的初步平衡值。Step 2.
::步骤2。Decide whether the economic change being analyzed affects demand or supply. In other words, does the event refer to something in the list of demand factors or supply factors?
::决定所分析的经济变化是否影响需求或供应,换句话说,事件是指需求因素或供应因素清单中的某些因素吗?Step 3.
::步骤3。Decide whether the effect on demand or supply causes the curve to shift to the right or to the left, and sketch the new demand or supply curve on the diagram. In other words, does the event increase or decrease the amount consumers want to buy or producers want to sell?
::决定对需求或供应的影响是导致曲线向右还是向左移动,并在图表上勾画新的需求或供应曲线。 换句话说,事件是增加还是减少消费者想要购买的数量还是生产者想要出售的数量?Step 4.
::步骤4。Identify the new equilibrium and then compare the original equilibrium price and quantity to the new equilibrium price and quantity.
::确定新的平衡,然后将原来的平衡价格和数量与新的平衡价格和数量进行比较。Let’s consider one example that involves a shift in supply and one that involves a shift in demand. Then we will consider an example where both supply and demand shift.
::让我们考虑一个例子,它涉及到供应的转变和需求的变化。 然后我们再考虑一个供求的转变的例子。Application: Good Weather for Salmon Fishing
::应用:鲑鱼捕捞的好天气In the summer of 2000, weather conditions were excellent for commercial salmon fishing off the California coast. Heavy rains meant higher than normal levels of water in the rivers, which helps the salmon to breed. Slightly cooler ocean temperatures stimulated the growth of plankton, the microscopic organisms at the bottom of the ocean food chain, providing everything in the ocean with a hearty food supply. The ocean stayed calm during fishing season, so commercial fishing operations did not lose many days to bad weather. How did these climate conditions affect the quantity and price of salmon?
::2000年夏季,气候条件对加利福尼亚沿岸商业鲑鱼捕捞来说是极好的。 大雨意味着河流水量高于正常水平,有助于鲑鱼繁殖。 较冷的海洋温度刺激了浮游生物的生长,即海洋食物链底部的微小生物,为海洋中所有生物提供了心重食品供应。 海洋在捕鱼季节保持平静,因此商业捕鱼作业不会因恶劣天气损失许多天。 这些气候条件如何影响鲑鱼的数量和价格?[ 2] illustrates the four-step approach, which is explained below, to work through this problem. [ 2] provides the information to work the problem as well.
::[2] 说明解决这一问题的四步办法,下文将对此加以解释。 [2] 也为解决这一问题提供信息。Good Weather for Salmon Fishing: The Four-Step Process
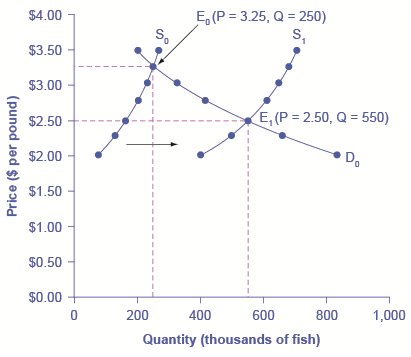
::鲑鱼捕捞的好天气:四步四步进程Unusually good weather leads to changes in the price and quantity of salmon.
::天气异常好导致鲑鱼的价格和数量发生变化。Salmon Fishing
::鲑鱼捕捞Price per Pound
::每英镑价格Quantity Supplied in 1999
::1999年供应数量Quantity Supplied in 2000
::2000年供应数量Quantity Demanded
::所需数量$2.00
80
400
840
$2.25
120
480
680
$2.50
160
550
550
$2.75
200
600
450
$3.00
230
640
350
$3.25
250
670
250
$3.50
270
700
200
Step 1. Draw a demand and supply model to illustrate the market for salmon in the year before the good weather conditions began. The demand curve D 0 and the supply curve S 0 show that the original equilibrium price is $3.25 per pound and the original equilibrium quantity is 250,000 fish. (This price per pound is what commercial buyers pay at the fishing docks; what consumers pay at the grocery is higher.)
::步骤1. 绘制供需模式,以说明在良好气候条件开始之前的一年里鲑鱼市场;需求曲线D0和供应曲线S0表明,最初的平衡价格为每磅3.25美元,最初的平衡数量为每磅25万鱼。 (这一价格是商业买家在捕鱼码头支付的价格;消费者在杂货店支付的价格更高。 )Step 2 . Did the economic event affect supply or demand? Good weather is an example of a natural condition that affects supply.
::步骤2. 经济事件是否影响到供求?良好的天气是影响供需的自然条件的一个实例。Step 3. Was the effect on supply an increase or a decrease? Good weather is a change in natural conditions that increases the quantity supplied at any given price. The supply curve shifts to the right, moving from the original supply curve S 0 to the new supply curve S 1 , which is shown in both the table and the figure.
::第3步:对供应的影响是增加还是减少?良好的天气是自然条件的变化,增加了以任何特定价格供应的数量;供应曲线向右移动,从原来的供应曲线S0向新的供应曲线S1转移,表和图均显示。Step 4. Compare the new equilibrium price and quantity to the original equilibrium. At the new equilibrium E 1 , the equilibrium price falls from $3.25 to $2.50, but the equilibrium quantity increases from 250,000 to 550,000 salmon. Notice that the equilibrium quantity demanded increased, even though the demand curve did not move.
::第4步:将新的平衡价格和数量与原平衡进行比较。在新的平衡E1中,平衡价格从3.25美元下降到2.50美元,但平衡数量从250 000鲑鱼增加到550 000鲑鱼。注意平衡数量要求增加,尽管需求曲线没有移动。In short, good weather conditions increased supply of the California commercial salmon. The result was a higher equilibrium quantity of salmon bought and sold in the market at a lower price.
::简言之,良好的天气条件增加了加利福尼亚商业鲑鱼的供应量,结果是在市场上以较低价格买卖的鲑鱼的均衡量较高。
Application: Newspapers and the Internet
::应用:报纸和因特网According to the Pew Research Center for People and the Press, more and more people, especially younger people, are getting their news from online and digital sources. The majority of U.S. adults now own smartphones or tablets, and most of those Americans say they use them in part to get the news. From 2004 to 2012, the share of Americans who reported getting their news from digital sources increased from 24% to 39%. How has this affected consumption of print news media, and radio and television news? [ 3] and the text below illustrates using the four-step analysis to answer this question.
::根据皮尤新闻研究中心的数据,越来越多的人,特别是年轻人,正在从网上和数字来源获得消息。 大多数美国成年人现在拥有智能手机或平板电脑,而大多数美国人说他们部分地使用这些手机或平板电脑获取新闻。 2004年至2012年,报道从数字来源获取新闻的美国人比例从24%上升到39%。 这对印刷媒体、广播电视新闻的消费产生了何种影响? [3] 以及下面的文字用四步分析来回答这个问题。The Print News Market: A Four-Step Analysis
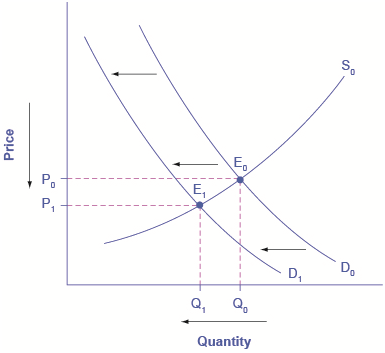
::《印刷新闻市场:四步分析》A change in tastes from print news sources to digital sources results in a leftward shift in demand for the former. The result is a decrease in both equilibrium price and quantity.
::将印刷新闻来源的口味改变为数字来源,导致对前者的需求向左倾移,结果是平衡价格和数量都下降。Step 1. Develop a demand and supply model to think about what the market looked like before the event. The demand curve D 0 and the supply curve S 0 show the original relationships. In this case, the analysis is performed without specific numbers on the price and quantity axis.
::步骤1. 开发供需模式,以思考事发前的市场情况,需求曲线D0和供应曲线S0显示了原始关系,在此情况下,分析是在没有价格和数量轴的具体数字的情况下进行的。Step 2. Did the change described affect supply or demand? A change in tastes, from traditional news sources (print, radio, and television) to digital sources, caused a change in demand for the former.
::步骤2. 所述变化是否影响到供求?从传统新闻来源(印刷品、广播和电视)到数字来源的口味的改变导致对前者的需求的改变。Step 3. Was the effect on demand positive or negative? A shift to digital news sources will tend to mean a lower quantity demanded of traditional news sources at every given price, causing the demand curve for print and other traditional news sources to shift to the left, from D 0 to D 1 .
::第3步:对需求的影响是正的还是负的?向数字新闻来源的转变,往往意味着对传统新闻来源的需求量会降低,以每一特定价格计算,从而导致对印刷和其他传统新闻来源的需求曲线从D0转向D1。Step 4. Compare the new equilibrium price and quantity to the original equilibrium price. The new equilibrium (E 1 ) occurs at a lower quantity and a lower price than the original equilibrium (E 0 ).
::4. 将新平衡价格和新数量与原平衡价格作比较,新平衡(E1)以低于原平衡(E0)的数量和低价格发生。The decline in print news reading predates 2004. Print newspaper circulation peaked in 1973 and has declined since then due to competition from television and radio news. In 1991, 55% of Americans indicated they got their news from print sources, while only 29% did so in 2012. Radio news has followed a similar path in recent decades, with the share of Americans getting their news from radio declining from 54% in 1991 to 33% in 2012. Television news has held its own over the last 15 years, with a market share staying in the mid to upper fifties. What does this suggest for the future, given that two-thirds of Americans under 30 years old say they do not get their news from television at all?
::2004年以前印刷新闻读数下降,1973年印刷报纸发行量达到峰值,此后由于电视和广播新闻的竞争而下降。 1991年,55%的美国人表示他们从印刷来源获得新闻,而2012年只有29 % 。 近几十年来,无线电新闻也遵循了类似的路径,美国人从电台获得新闻的比例从1991年的54%下降到2012年的33%。 过去15年来,电视新闻保持了自己的地位,市场份额一直维持在五十年代中上半叶。 考虑到三分之二的30岁以下的美国人说完全没有从电视获得新闻,这对未来有什么意义?A Combined Example
::综合示例Application: A Combined Example
::应用:综合示例The U.S. Postal Service is facing difficult challenges. Compensation for postal workers tends to increase most years due to cost-of-living increases. At the same time, more and more people are using email, text, and other digital message forms such as Facebook and Twitter to communicate with friends and others. What does this suggest about the continued viability of the Postal Service? [ 4] and the text below illustrates using the four-step analysis to answer this question.
::美国邮政局正面临困难的挑战。 邮政工人的补偿由于生活费增加,往往会增加大部分年份。 与此同时,越来越多的人使用电子邮件、短信和其他数字信息形式(如Facebook和Twitter)与朋友和其他人沟通。 这对邮政局的持续生存能力有什么影响? [4] 和下面的文字用四步分析来解答这个问题。Higher Compensation for Postal Workers: A Four-Step Analysis
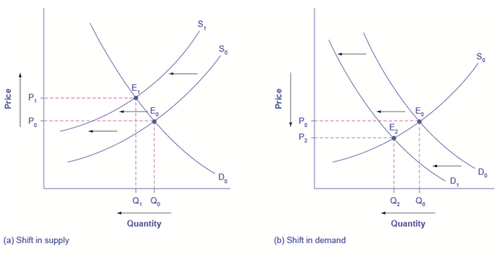
::邮政工人高报酬:四步分析(a) Higher labor compensation causes a leftward shift in the supply curve, a decrease in the equilibrium quantity, and an increase in the equilibrium price. (b) A change in tastes away from Postal Services causes a leftward shift in the demand curve, a decrease in the equilibrium quantity, and a decrease in the equilibrium price.
:a) 劳动报酬的提高导致供应曲线向左倾移,平衡数量下降,平衡价格上升。 (b) 远离邮政服务的口味的改变导致需求曲线向左倾移,平衡数量下降,平衡价格下降。
Since this problem involves two disturbances, we need two four-step analyses, the first to analyze the effects of higher compensation for postal workers, the second to analyze the effects of many people switching from “snail mail” to email and other digital messages.
::由于这个问题涉及两次骚乱,我们需要两个四步分析,第一个是分析对邮政工人高报酬的影响,第二个是分析许多人从“无线邮件”转向电子邮件和其他数字信息的影响。Since this problem involves two disturbances, we need two four-step analyses, the first to analyze the effects of higher compensation for postal workers, the second to analyze the effects of many people switching from “snail mail” to email and other digital messages.
::由于这个问题涉及两次骚乱,我们需要两个四步分析,第一个是分析对邮政工人高报酬的影响,第二个是分析许多人从“无线邮件”转向电子邮件和其他数字信息的影响。[ 4 (a)] shows the shift in supply discussed in the following steps.
::[4(a)] 显示以下步骤所讨论的供应变化。Step 1. Draw a demand and supply model to illustrate what the market for the U.S. Postal Service looked like before this scenario starts. The demand curve D 0 and the supply curve S 0 show the original relationships.
::步骤1. 绘制供需模式,以说明美国邮政局在这一假想开始之前的市场情况。需求曲线D0和供应曲线S0显示了原始关系。Step 2 . Did the change described affect supply or demand? Labor compensation is a cost of production. A change in production costs caused a change in supply for the Postal Service.
::步骤2. 所述变化是否影响到供求?劳动补偿是一种生产成本,生产成本的变化导致邮政服务供应的变化。Step 3. Was the effect on supply positive or negative? Higher labor compensation leads to a lower quantity supplied of traditional news sources at every given price, causing the supply curve for print and other traditional news sources to shift to the left, from S 0 to S 1 .
::第3步:对供应的影响是正面的还是负面的?更高的劳动报酬导致以每一特定价格提供的传统新闻来源数量减少,导致印刷和其他传统新闻来源的供应曲线从S0转向S1。Step 4 . Compare the new equilibrium price and quantity to the original equilibrium price. The new equilibrium (E 1 ) occurs at a lower quantity and a higher price than the original equilibrium (E 0 ).
::4. 将新平衡价格和新数量与原平衡价格作比较,新平衡(E1)以低于原平衡(E0)的数量和较高价格发生。[ 4 (b)] shows the shift in demand discussed in the following steps.
::[4(b)] 表明以下步骤所讨论的需求变化。Step 1. Draw a demand and supply model to illustrate what the market for U.S. Postal Services looked like before this scenario starts. The demand curve D 0 and the supply curve S 0 show the original relationships. Note that this diagram is independent of the diagram in panel (a).
::步骤1. 绘制供需模式,以说明美国邮政局在这一设想方案开始之前的市场情况。需求曲线D0和供应曲线S0显示了原始关系。请注意,该图表独立于面板(a)中的图表。Step 2. Did the change described affect supply or demand? A change in tastes away from snail mail toward digital messages will cause a change in demand for the Postal Service.
::步骤2. 所述变化是否影响到供求?将螺旋桨邮件的口味改变为数字信息将改变邮政服务的需求。Step 3. Was the effect on supply positive or negative? A change in tastes away from snail mail toward digital messages leads to a lower quantity demanded of Postal Services at every given price, causing the demand curve for Postal Services to shift to the left, from D 0 to D 1 .
::第3步:对供应的影响是正的还是负的?从蜗牛邮件向数字信息转变的口味导致邮政服务以每一特定价格对邮政服务的需求减少,导致邮政服务的需求曲线向左移动,从D0转向D1。Step 4. Compare the new equilibrium price and quantity to the original equilibrium price. The new equilibrium (E 2 ) occurs at a lower quantity and a lower price than the original equilibrium (E 0 ).
::4. 将新平衡价格和新数量与原平衡价格作比较,新平衡(E2)以低于原平衡(E0)的数量和低价格出现。The final step in a scenario where both supply and demand shift is to combine the two individual analyses to determine what happens to the equilibrium quantity and price. Graphically, we superimpose the previous two diagrams one on top of the other, as in [ 5].
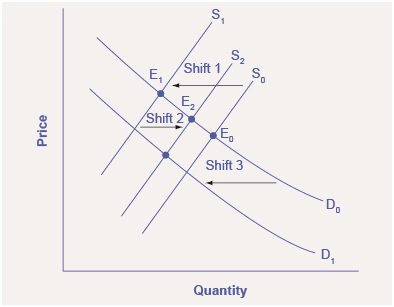
::供给和需求均转移的情景中的最后一步是将两个单项分析结合起来,以确定平衡数量和价格会发生什么。 从图表上看,我们将前两个图一加在另一个图中,如 [5] 。Combined Effect of Decreased Demand and Decreased Supply
::减少需求和减少供应的综合效应Supply and demand shifts cause changes in equilibrium price and quantity.
::供应和需求变化造成平衡价格和数量的变化。
Results:
::结果:Effect on Quantity:
::对数量的影响:The effect of higher labor compensation on Postal Services because it raises the cost of production is to decrease the equilibrium quantity. The effect of a change in tastes away from snail mail is to decrease the equilibrium quantity. Since both shifts are to the left, the overall impact is a decrease in the equilibrium quantity of Postal Services (Q 3 ). This is easy to see graphically, since Q 3 is to the left of Q 0 .
::高劳动报酬对邮政服务的影响是因为它提高了生产成本,它的影响是降低平衡数量。 改变螺旋桨邮件的口味的效果是降低平衡数量。 由于这两种转变都是向左转移,总体影响是邮政服务平衡数量下降(Q3 ) 。 这很容易用图形显示,因为问题3在Q0的左边。Effect on Price:
::对价格的影响:The overall effect on price is more complicated. The effect of higher labor compensation on Postal Services, because it raises the cost of production, is to increase the equilibrium price. The effect of a change in tastes away from snailmail is to decrease the equilibrium price. Since the two effects are in opposite directions, unless we know the magnitudes of the two effects, the overall effect is unclear. This is not unusual. When both curves shift, typically we can determine the overall effect on price or on quantity, but not on both. In this case, we determined the overall effect on the equilibrium quantity, but not on the equilibrium price. In other cases, it might be the opposite.
::对价格的总体影响更为复杂。 提高劳动报酬对邮政服务的影响,因为它提高了生产成本,就是提高平衡价格。 改变对蜗牛邮递的口味的影响是降低平衡价格。 由于这两种影响是相反的,除非我们知道两种影响的规模,否则总体影响并不明确。 这并非不寻常。 当两个曲线发生转变时,我们通常可以确定对价格或数量的总体影响,但不能同时确定两者。 在这种情况下,我们确定了对平衡数量的总体影响,而不是对平衡价格的总体影响。在其他情况下,它可能正好相反。What is the difference between shifts of demand or supply versus movements along a demand or supply curve?
::需求或供应的变化与沿着需求或供应曲线的流动之间有什么区别?One common mistake in applying the demand and supply framework is to confuse the shift of a demand or a supply curve with movement along a demand or supply curve. As an example, consider a problem that asks whether a drought will increase or decrease the equilibrium quantity and equilibrium price of wheat. Lee, a student in an introductory economics class, might reason:
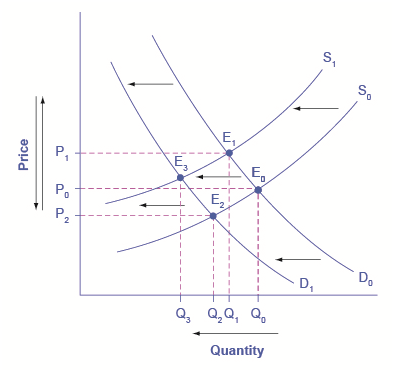
::应用供需框架的一个常见错误是将需求或供应曲线的转变与需求或供应曲线的变动混为一谈。 例如,考虑一个问题,即干旱是否会增加或降低小麦的均衡数量和平衡价格。 李(入门经济类学生)可能有理由认为:“Well, it is clear that a drought reduces supply, so I will shift back the supply curve, as in the shift from the original supply curve S 0 to S 1 shown on the diagram (called Shift 1). So the equilibrium moves from E 0 to E 1 , the equilibrium quantity is lower and the equilibrium price is higher. Then, a higher price makes farmers more likely to supply the good, so the supply curve shifts right, as shown by the shift from S 1 to S 2 , on the diagram (shown as Shift 2), so that the equilibrium now moves from E 1 to E 2 . The higher price, however, also reduces demand and so causes demand to shift back, like the shift from the original demand curve, D 0 to D 1 on the diagram (labeled Shift 3), and the equilibrium moves from E 2 to E 3 .”
::“很明显,干旱会减少供应量,因此我将把供应曲线向后移,就像从原供应曲线S0转向图上显示的S1(称为 Shift 1 ) 。 因此,平衡从E0向E1转移,平衡数量较低,平衡价格较高。 然后,更高的价格使农民更有可能供应商品,因此,供应曲线向右移动,如图上从S1向S2的转变(以 Shift 2的形式显示 ) , 这样平衡现在从E1向E2转移。 然而,更高的价格也减少了需求,从而导致需求向后转移,如从原需求曲线D0向D1的转变(标注为 Shift 3 ) , 以及平衡从E2向E3的转移。 ”Shifts of Demand or Supply versus Movements along a Demand or Supply Curve
::在需求或供应曲线上的需求或供应相对于流动的变化A shift in one curve never causes a shift in the other curve. Rather, a shift in one curve causes a movement along the second curve.
::一条曲线的移动永远不会导致另一条曲线的移动。 相反,一条曲线的移动会导致沿着第二条曲线的移动。At about this point, Lee suspects that this answer is headed down the wrong path. Think about what might be wrong with Lee’s logic, and then read the answer that follows.
::在这一点上,李怀疑这个答案是走错路了。 想想李的逻辑会有什么问题,然后读出接下来的答案。Answer: Lee’s first step is correct: that is, drought shifts back the supply curve of wheat and leads to a prediction of a lower equilibrium quantity and a higher equilibrium price. This corresponds to a movement along the original demand curve (D 0 ), from E 0 to E 1 . The rest of Lee’s argument is wrong, because it mixes up shifts in supply with quantity supplied, and shifts in demand with quantity demanded. A higher or lower price never shifts the supply curve, as suggested by the shift in supply from S 1 to S 2 . Instead, a price change leads to a movement along a given supply curve. Similarly, a higher or lower price never shifts a demand curve, as suggested in the shift from D 0 to D 1 . Instead, a price change leads to a movement along a given demand curve. Remember, a change in the price of a good never causes the demand or supply curve for that good to shift.
::答案是:李氏的第一步是正确的:那就是,干旱使小麦的供应曲线倒退,并导致对较低均衡数量和较高均衡价格的预测。 这与最初需求曲线(D0)从E0向E1的变动相对应。 李氏论点的其余部分是错误的,因为它混合了供应量和供应量的变动以及需求量的变动。 更高或更低的价格永远不会改变供应曲线,正如供应从S1向S2的转移所显示的那样。 相反,价格变化导致特定供应曲线的变动。 同样,正如从D0向D1的转变所暗示的那样,更高或更低的价格永远不会改变需求曲线。 相反,价格变化导致特定需求曲线的变动。 记住,商品价格的变化永远不会导致该商品的需求或供应曲线向转移。Think carefully about the timeline of events: What happens first, what happens next? What is the cause, what is the effect? If you keep the order right, you are more likely to get the analysis correct.
::仔细想想事件的时间表:首先会发生什么,接下来会发生什么?原因是什么,效果是什么?如果你保持正确的顺序,你更有可能得到正确的分析。In the four-step analysis of how economic events affect equilibrium price and quantity, the movement from the old to the new equilibrium seems immediate. As a practical matter, however, prices and quantities often do not zoom straight to equilibrium. More realistically, when an economic event causes demand or supply to shift, prices and quantities set off in the general direction of equilibrium. Indeed, even as they are moving toward one new equilibrium, prices are often then pushed by another change in demand or supply toward another equilibrium.
::在对经济事件如何影响平衡价格和数量进行四步分析的过程中,从旧的向新平衡的转变似乎是立即的。 但是,实际上,价格和数量往往不会直缩到平衡。 更现实地说,当经济事件导致需求或供应转移时,价格和数量会向总体平衡方向下降。 事实上,即使它们正在向一个新的平衡转变,价格也往往会因为需求或供应的另一种变化而推向另一种平衡。Demand, Supply, and Efficiency
::需求、供应和效率The familiar demand and supply diagram holds within it the concept of economic efficiency. One typical way that economists define efficiency is when it is impossible to improve the situation of one party without imposing a cost on another. Conversely, if a situation is inefficient, it becomes possible to benefit at least one party without imposing costs on others.
::熟悉的供求图表包含了经济效率概念。 经济学家定义效率的一个典型方式是当无法在不给另一方造成成本的情况下改善另一方的状况时。 相反,如果形势效率低下,至少可以让一方受益而不给另一方带来成本。Efficiency in the demand and supply model has the same basic meaning: The economy is getting as much benefit as possible from its scarce resources and all the possible gains from trade have been achieved. In other words, the optimal amount of each good and service is being produced and consumed.
::需求和供应模式的效率具有同样的基本意义:经济正在从其稀缺的资源中获得尽可能多的利益,贸易的所有可能收益已经实现,换言之,每种商品和服务的最佳数量正在生产和消费。The economists often use the economic model to help analyze behavior and predict outcomes. These models are often represented with supply and demand curves in order to example the concept of market equilibrium to show how prices are relatively stable and the quantity of output supplies is equal to the quantity demanded. Prices in a competitive market are established by supply and demand. If prices are too high there will be a surplus. If prices are too low there will be a shortage. Eventually the market will correct itself so that it reaches market equilibrium and there will be neither a surplus nor a shortage.
::经济学家经常使用经济模型来帮助分析行为和预测结果。 这些模型往往以供需曲线来代表。 以市场平衡的概念为例,以表明价格如何相对稳定,产出供应的数量如何与要求的数量相等。 竞争性市场的价格是由供求决定的。 如果价格太高,就会出现顺差。 如果价格太低,就会出现短缺。 最终,市场会纠正自己,以达到市场平衡,不会出现顺差,也不会出现短缺。Prices will change in response to a change in supply or a change in demand. What economists have determined is that the size of the price changes are affected by "elasticity". Price elasticity can influence consumers. An item that is a luxury may be demand more if the product goes on sale, however, if the product is a need then the change in price does not usually influence consumer demand.
::价格会随着供应变化或需求变化而变化。 经济学家已经确定,价格变化的规模会受到“弹性”的影响。 价格弹性会影响消费者。 如果产品继续销售,奢侈品的需求可能更大,但是,如果产品是需要,价格变化通常不会影响消费者需求。Of course the theory of competitive pricing is just that, a theory. It represents a set of ideal conditions and outcomes and is another model that allows economists to measure the performance of less competitive markets.
::当然,竞争性定价理论只是一种理论。 它代表了一套理想的条件和结果,也是经济学家衡量竞争力较差的市场绩效的另一种模式。Read this article that addresses how the 2012 drought impacted food prices:
::本文讨论2012年干旱如何影响粮食价格:Answer the self check questions below to monitor your understanding of the concepts in this section.
::回答下面的自我核对问题,以监测你对本节概念的理解。Self Check Questions
::自查问题1. What is an economic model?
::1. 什么是经济模式?2. What is market equilibrium?
::2. 什么是市场平衡?3. How does the market find its equilibrium?
::3. 市场如何找到平衡?4. What is a surplus? Why does it occur?
::4. 什么是盈余?为什么出现盈余?5. What is a shortage? Why does it occur?
::5. 什么是短缺?为什么会出现短缺?6. What is equilibrium price?
::6. 什么是平衡价格?7. Why do economists use models?
::7. 经济学家为何使用模型?8. What is the theory of competitive pricing?
::8. 什么是竞争性定价理论? -
Changes in supply and demand cause prices to change.