3.11 经济发展
章节大纲
-
Economic Development
::经济发展 经济发展Since GDP is measured in a country’s currency, in order to compare different countries’ GDPs, we need to convert them to a common currency. One way to do that is with the exchange rate, which is the price of one country’s currency in terms of another. Once GDPs are expressed in a common currency, we can compare each country’s GDP per capita by dividing GDP by population. Countries with large populations often have large GDPs, but GDP alone can be a misleading indicator of the wealth of a nation. A better measure is GDP per capita.
::由于GDP是以一个国家的货币衡量的,为了比较不同国家的GDP,我们需要把它们转换成一种共同货币。 一种方法就是汇率,即一国货币以另一个货币计算的价格。 一旦GDP以共同货币表示,我们就能用人口来将每个国家的人均GDP除以人口来比较。 人口众多的国家往往拥有大量的GDP,但单是GDP就有可能误导一个国家的财富。 更好的衡量标准是人均GDP。The rate of productivity growth is the primary determinant of an economy’s rate of long-term economic growth and higher wages. Over decades and generations, seemingly small differences of a few percentage points in the annual rate of economic growth make an enormous difference in GDP per capita. Capital deepening refers to an increase in the amount of capital per worker, either human capital per worker, in the form of higher education or skills, or physical capital per worker. A healthy climate for growth in GDP per capita consists of improvements in human capital, physical capital, and technology in a market-oriented environment with supportive public policies and institutions.
::生产率增长率是经济长期经济增长率和较高工资的首要决定因素。 几十年来,经济年增长率中似乎只有几个百分点的微小差异在人均GDP中造成了巨大的差异。 资本深化指的是每个工人的资本数量增长,无论是以高等教育或技能为形式,还是以每个工人的有形资本为形式。 人均GDP增长的健康环境包括人力资本、实物资本和技术在支持性公共政策和机构的面向市场的环境下的改善。When countries with lower levels of GDP per capita catch up to countries with higher levels of GDP per capita, the process is called convergence. Convergence can occur even when both high-income and low-income countries increase investment in the physical and human capital with the objective of growing GDP. This is because the impact of new investment in physical and human capital on a low-income country may result in huge gains as new skills or equipment are combined with the labor force. In higher-income countries, however, a level of investment equal to that of the low-income country is not likely to have as big an impact, because the more developed country most likely has high levels of capital investment.
::当人均国内总产值水平较低的国家赶上人均国内总产值水平较高的国家时,这一过程就被称为趋同;即使高收入和低收入国家都增加了对有形资本和人力资本的投资,目标是增加国内生产总值,也可能出现趋同;这是因为对低收入国家的有形资本和人力资本的新投资的影响,随着新技术或设备与劳动力的结合,可能会带来巨大的收益;然而,在高收入国家,与低收入国家相同的投资水平不太可能产生同样大的影响,因为较发达的国家最有可能拥有高水平的资本投资。Universal Generalizations
::普遍化-
Developing countries face a number of obstacles that make economic growth extremely difficult.
::发展中国家面临若干障碍,使经济增长极为困难。 -
Developing countries are home to more than half the world's population.
::发展中国家是世界人口一半以上的家园。
Guiding Questions
::问 问 问 问 问 问 问 问 问 问 问 问 问 问 问 问 问 问 问 问 问 问 问 问 问 问 问 问 问 问 问 问 问 问 问 问 问 问 问 问 问 问 问 问 问 问 问 问 问 问 问 问 问 问 问 问 问 问 问 问 问 问 问 问 问 问 问 问 问 问 问 问 问 问 问 问 问 问 问 问 问 问 问 问 问 问 问 问 问 问 问 问 问 问 问 问 问 问-
List at least three reasons why developing countries have a difficult time becoming industrialized.
::发展中国家难以工业化的原因至少有三个。 -
Why would social issues a country faces inhibit its ability to develop economically?
::为什么一个国家面临的社会问题会阻碍其经济发展能力? -
What do you think are two of the most important things a country can do to become more industrialized?
::你认为,为了变得更工业化, 一个国家可以做的最重要的两个事情是什么?
Video: Developed vs. Developing
::录像:发达国家与发展中国家Why is a Country Considered Developing?
::为什么“发展中国家”被认为是发展中国家?Developing countries tend to suffer from similar problems and challenges. The first major issue is population growth. Compared to developed nations, Third World countries tend to have high birth rates, high mortality rates, and a shorter life expectancy. These nations also have less health care, less educational opportunities, and limited technology. Due to poor health and limited education, it is not hard to understand why their population lacks the skills necessary to create technology or develop a sufficient infrastructure. In addition, their nation may not have the natural resources necessary for trade or industrial development. The climate and geography may not be able to sustain sufficient amounts of food or to provide adequate fresh water. Religion may also stand in the way of development. In some nations women are not allowed to be educated, to participate in politics, or to work outside of the home. When a large portion of a country is prevented from participating in the economy, in this case women, additional labor or entrepreneurs that may not be able to contribute to the growth of the nation. Another example of religion at odds with economic development regards those religions that are not interested in the Western concept of economic growth and development.
::第一个主要问题是:与发达国家相比,第三世界国家的出生率高、死亡率高、预期寿命短;这些国家的保健水平低、教育机会少、技术有限;由于健康状况差和教育程度有限,不难理解为什么它们的人口缺乏创造技术或发展足够基础设施的必要技能;此外,它们的国家可能没有贸易或工业发展所必需的自然资源;气候和地理可能无法维持足够的粮食或提供足够的淡水;宗教也可能阻碍发展;有些国家不允许妇女接受教育、参政或走出家门工作;当一个国家的大部分人口无法参与经济时,妇女、可能无法为国家成长作出贡献的更多劳动力或企业家;宗教与经济发展不相容的另一个例子是那些对西方经济增长和发展概念不感兴趣的宗教。A developing country may have a difficult time acquiring international loans, paying off current debts, or preventing its own capital from leaving the country (capital flight). Lastly, some Third World nations experience corruption in the government and in the economy. When a nation allows bribery and deceit to do business, it prevents economic development from taking place by those who would benefit most from economic growth. The impact of war can affect any nation, however, when examining developing nations, it tends to have the most immediate and long-lasting consequences. War destroys limited infrastructure and agriculture, creates additional chaos and refugees, and may cause the "intelligentsia" to flee.
::发展中国家可能很难获得国际贷款,偿还当前债务,或阻止自己的资本离开本国(资本外逃),最后,第三世界一些国家在政府和经济中出现腐败。当一个国家允许贿赂和欺骗来做生意时,它会阻止那些从经济增长中受益最大的国家的经济发展。然而,战争的影响会影响到任何国家,但是,在审查发展中国家时,它往往会产生最直接和长期的后果。 战争摧毁了有限的基础设施和农业,造成了更多的混乱和难民,并可能导致“知识分子”逃离。Poverty and Economic Development
::贫穷与经济发展Throughout most of history, poverty has been the human condition. For most people life was, in the words of 17th-century English philosopher Thomas Hobbes, “solitary, poor, nasty, brutish, and short.” Only within the past 200 years have a handful or so of countries been able to break the chains of economic deprivation and poverty.
::纵观整个历史,贫困一直是人类的状况。 17世纪英国哲学家托马斯·霍布斯(Thomas Hobbes)说 , “ 孤独、贫穷、肮脏、野蛮和短暂 ” , 对大多数人来说,贫困是人类的状况。 在过去的200年中,只有极少数国家能够打破经济贫困和贫困的链条。Consider these facts:
::考虑这些事实:-
Over a third of the world’s people live in countries in which total per capita income in 2005 was less than $610 per year; 85% live in countries in which total per capita income in 2005 was $2,808 or less. Adjusting for purchasing power, the per capita income levels would be $2,531 and $7,416, respectively. The latter numbers compare to per capita income in high-income countries of over $30,000.
::世界人口的三分之一以上生活在2005年人均收入总额低于每年610美元的国家;85%生活在2005年人均收入总额为2,808美元或低于2,808美元的国家。 按购买力调整后,人均收入水平将分别为2,531美元和7,416美元,后者与高收入国家的人均收入超过30,000美元相比。 -
Babies born in poor countries are 16 times more likely to die in their first five years than babies born in rich countries.
::在穷国出生的婴儿头五年死亡的可能性比在富国出生的婴儿高16倍。 -
About a quarter of the populations of low-income countries is undernourished.
::低收入国家约四分之一的人口营养不良。 -
About 40% (over 50% for women) of the people 15 years old and older in low-income countries are illiterate.
::低收入国家15岁及以上人口中,约40%(妇女超过50%)为文盲。 -
Roughly one-fourth of the people in low-income countries do not have access to safe drinking water.
::低收入国家大约四分之一的人口无法获得安全饮用水。
United Nations Development Program, Human Development Report 2007/2008 (New York: Palgrave Macmillan, 2007).
Clearly, the high standards of living enjoyed by people in the world’s developed economies are the global exception, not the rule. This chapter looks at the problem of improving the standard of living in poor countries.
::显然,世界发达经济体人民享有的高生活水平是全球例外,而不是常规。 本章审视了提高穷国生活水平的问题。Rich and Poor Nations
::富国和穷国The World Bank, an international organization designed to support economic development by providing financial assistance, advice, and other resources to poor countries, classifies over 200 countries according to their levels of per capita gross national income. The categories in its 2008 report, as shown in Table 19.1 "World Incomes, Selected Countries", were as follows:
::世界银行是一个国际组织,旨在通过向穷国提供财政援助、咨询和其他资源来支持经济发展,它根据人均国民总收入水平,将200多个国家分类。-
Low-income countries: These countries had per capita incomes of $935 or less in 2007. There were 49 countries in this category. About 20% of the world’s total population of about 6.5 billion people lived in low-income countries in 2007.
::低收入国家:这些国家2007年的人均收入为935美元或低于935美元,这类国家有49个。 2007年,世界人口总数约为65亿,其中约20%生活在低收入国家。 -
Middle-income countries: There were 95 countries with per capita incomes of more than $936 but less than $11,455. Middle-income countries are further subdivided into lower middle-income and upper middle-income countries. Roughly two-thirds of the world’s population lived in middle-income countries in 2007. We should note that the percentage of the world’s population living in middle-income countries increased dramatically (and the percentage living in low-income countries decreased dramatically) when China and India moved from being low-income to middle-income countries.
::中等收入国家:有95个国家人均收入超过936美元,但不到11 455美元。 中等收入国家进一步细分为中低收入国家和中上收入国家。 2007年,全世界约有三分之二的人口生活在中等收入国家。 我们应该指出,当中国和印度从低收入国家转向中等收入国家时,生活在中等收入国家的世界人口比例急剧上升(而低收入国家的人口比例则急剧下降 ) 。 -
High-income countries: There were 65 nations with per capita incomes of $11,456 or more. Just 16% of the world’s total population lived in high-income countries in 2007.
::高收入国家:有65个国家人均收入为11 456美元或以上。 2007年,世界上只有16%的人口生活在高收入国家。
Countries in the low-income and middle-income cate gories are often called developing countries. A developing country is thus a country that is not among the high-income nations of the world. The World Development Report 2006 (New York: Oxford University Press, 2006, xiv), comments on t his usage: “The term developing countries include low- and middle-income economies and thus may include economies in transition from central planning, as a matter of convenience. The term advanced countries may be used as a matter of convenience to denote high-income economics.” Developing countries are sometimes referred to as third-world countries.
::《2006年世界发展报告》(纽约:牛津大学出版社,2006年,十四),对此使用的评论:“发展中国家包括低收入和中等收入经济体,因此,为了方便起见,可能包括从中央规划过渡的经济体,发达国家一词可以作为表示高收入经济的方便事项。” 发展中国家有时被称为第三世界国家。How does the World Bank compare incomes across countries? The World Bank converts gross national income (GNI) figures to dollars in two ways. One is to take GNI in a local currency and convert using the exchange rate, averaged over a three-year period in order to smooth out the effects of currency fluctuations. This type of comparison can, however, be misleading. A country could have a relatively high standard of living but, for a variety of reasons, a low exchange rate. The per capita GNI figure would be quite low; the country would appear to be poorer than it is.
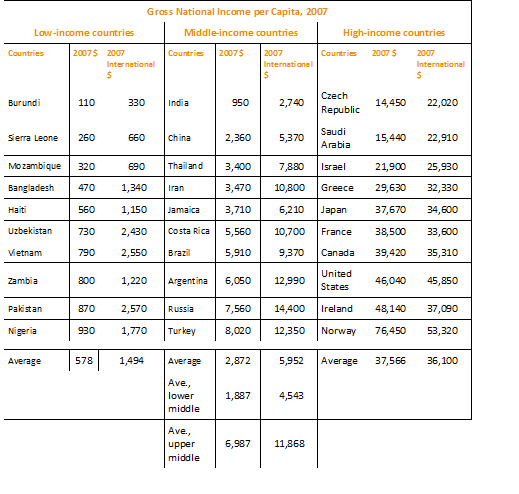
::世界银行如何对各国收入进行比较?世界银行以两种方式将国民总收入(GNI)数字换算成美元:一是用当地货币计算GNI,并使用三年平均汇率换算,以缓解货币波动的影响;三年期间平均汇率换算,但这种比较可能会产生误解;一国的生活水平可能相对较高,但出于各种原因,汇率较低;人均GNI数字将相当低;该国似乎比现在更穷。A better approach to comparing incomes converts currencies to dollars on the basis of purchasing power. This measure is reported in what is called international dollars. An international dollar has the same purchasing power as does a U.S. dollar in the United States. This is reported in the column labeled “2007 International $” in Figure 1: "World Incomes, Selected Countries".
::比较收入根据购买力将货币换算成美元的方法更好,这一计量以国际美元报告,国际美元与美国美元具有相同的购买力,在图1“世界收入,选定国家”中“2007年国际美元”一栏列报。Figure 1: World Incomes, Selected Countries
::图1:世界收入,选定国家Source: World Development Indicators database, World Bank, revised October 17, 2008.
The international dollar estimates typically show higher incomes than estimates based on an exchange rate conversion. For example, in 2007 Mozambique’s per capita GNI, based on exchange rates, was $320. Its per capita GNI based the international dollars was $690.
::国际美元估计数通常显示收入高于根据汇率换算得出的估计数。 比如,2007年莫桑比克根据汇率计算的人均国民总收入为320美元。 以国际美元计算的人均国民总收入为690美元。Ranking of countries, both rich and poor, by per capita GNI differs depending on the measure used. According to the per capita GNI figures in Table 19.1 "World Incomes, Selected Countries", which convert data in domestic currencies to dollars using exchange rates, the United States ranked fifteenth of all countries in 2007. Using the international dollars method, its rank is tenth. China is ranked at 132 when per capita GNI is based on the exchange rate conversion method but rises to 122 based on the international dollar method.
::表19.1“世界收入,选定国家”中将国内货币数据换算成美元,根据使用汇率将国内货币数据换算成美元的表19.1“世界收入,选定国家”中的人均国民总收入数字,美国2007年在所有国家中排名第十五位,采用国际美元方法,排名第十位。如果人均国民总收入以汇率换算法为基础,但根据国际美元方法上升到122,中国排名第132位。Characteristics of Low-Income Countries
::低收入国家的特点Low incomes are often associated with other characteristics: severe inequality, poor health care and education, high unemployment, heavy reliance on agriculture, and rapid population growth. We will examine most of these problems in this section. Population growth in low-income nations is examined later in the chapter.
::低收入往往与其他特点有关:严重不平等、保健和教育不良、高失业率、严重依赖农业和人口迅速增长。我们将在本节中审查这些问题的多数。Inequality
::不平等Not only are incomes in low-income countries quite low; income distribution is often highly unequal. Poverty is far more prevalent than per capita numbers suggest, as illustrated by Lorenz curves, introduced in the chapter on inequality, that show the cumulative shares of income received by individuals or groups.
::不仅低收入国家的收入相当低;收入分配往往极不平等,贫穷比人均数字普遍得多,如关于不平等的一章中介绍的洛伦茨曲线所示,它显示了个人或群体所得收入的累积份额。Consider Costa Rica and Panama, two Latin American countries with roughly equivalent levels of per capita GNI (Costa Rica’s was $5,560 and Panama’s $5,510 in 2007). Panama’s income distribution is comparatively less equal, while Costa Rica’s is far more equal. Figure 2: "Poverty and the Distribution of Income: Costa Rica versus Panama" compares the 2003 Lorenz curves for Costa Rica and Panama, the most recent year for which the information was available. The 20% of the households with the lowest incomes in Costa Rica had twice as large a share of their country’s total income as did the bottom 20% of households in Panama. That means Costa Rica’s poor were about twice as well off, in material terms, as Panama’s poor.
::考虑到哥斯达黎加和巴拿马这两个人均国民总收入水平大致相当的拉丁美洲国家(2007年哥斯达黎加为5,560美元,巴拿马为5,510美元),巴拿马的收入分配相对较少,而哥斯达黎加的收入分配则相当。 图2:“贫困与收入分配:哥斯达黎加与巴拿马”比较了哥斯达黎加和巴拿马2003年的洛伦茨曲线,这是有资料可查的最近一年。 哥斯达黎加20%收入最低的家庭占其国家总收入的比例是巴拿马最低的20%的两倍。 这意味着哥斯达黎加穷人在物质上是巴拿马穷人的两倍。Figure 2: Poverty and the Distribution of Income: Costa Rica versus Panama
::图2:贫穷和收入分配:哥斯达黎加与巴拿马
Source: World Development Indicators Online (revised October 17, 2008). Costa Rica had about the same per capita GNI as Panama in 2003, but Panama’s income distribution was far more unequal. Panama’s poor had much lower living standards than Costa Rica’s poor, as suggested by the Lorenz curves for the two nations.
In general, the greater the degree of inequality, the more desperate is the condition of people at the bottom of an income distribution. Given the high degree of inequality in many low-income countries, it is very important to look at income distributions when we compare living standards in different countries.
::总的来说,不平等程度越大,收入分配底层人民的状况就越令人绝望。 鉴于许多低收入国家的高度不平等,当我们比较不同国家的生活水平时,审视收入分配非常重要。Video: The Education Crisis in Developing Countries
::录像:发展中国家教育危机Health and Education
::卫生与教育Poor nations are typically characterized by low levels of human capital. Where health-care facilities are inadequate, that human capital can be reduced further by disease. Where educational resources are poor, there will be little progress in improving human capital. One indicator of poor health care appears on the supply side. Low-income countries have fewer doctors, relative to their populations than high-income countries. For example, the UN estimates that in 2006 about 60% of mothers giving birth in developing countries had access to a skilled health-care provider (doctor, nurse, or midwife). While that is up from 47% in 1990, the lack of access to a healthcare provider may explain much of the difference in maternal death rates between developed and developing countries: about nine maternal deaths per 100,000 live births in developed countries compared to about 450 per 100,000 in developing countries. (Source: United Nations, The Millennium Development Goals Report 2008, 27)
::贫穷国家的典型特点是人力资本水平低。在保健设施不足的地方,人力资本可能因疾病而进一步减少。在教育资源贫乏的地方,在改善人力资本方面进展甚微。保健不良的一个指标出现在供应方面。与高收入国家相比,低收入国家的医生相对其人口较少。例如,联合国估计,2006年,发展中国家约60%的分娩母亲有机会获得熟练的保健提供者(医生、护士或助产士)。虽然1990年只有47 % ,但缺乏获得保健提供者的机会可能解释发达国家和发展中国家之间产妇死亡率的差别:发达国家每100 000名活产中约有9名产妇死亡,而发展中国家为每100 000名活产中约450名产妇死亡。 (资料来源:联合国,《2008年千年发展目标报告》,第27页)We can also see the results of poor health care in statistics on health. Among the world’s developing countries, the infant mortality rate, which reports deaths in the first year of life, was 57 per 1,000 live births in 2005. There were six infant deaths per 1,000 live births among the high-income countries that year. (Source: United Nations Development Program, Human Development Report 2007/2008 (New York: Palgrave Macmillan, 2007), 264. )
::我们还可以看到健康统计中保健差的结果。 在世界上的发展中国家中,2005年婴儿死亡率为每1 000名活产死亡57人,2005年,高收入国家每1 000名活产死亡6人。 (资料来源:联合国开发计划署,《2007/2008年人类发展报告》(纽约:Palgrave Macmillan,2007年),264人。 )Another health issue facing the world’s low-income countries is malnutrition. Malnutrition rates in all developing countries in the 2002 to 2004 period averaged 17%, while 35% was the standard in the least developed countries.
::世界低收入国家面临的另一个健康问题是营养不良。 2002-2004年期间,所有发展中国家的营养不良率平均为17%,而最不发达国家的标准为35%。Still another issue is the spread of HIV/AIDS. Here there is some progress. The number of people newly infected declined from 3 million in 2001 to 2.7 million in 2005. Antiretroviral treatments are also leading to a reduction in deaths from 2.2 million in 2005 to 2 million in 2007. Longer survival means that the number of people living with HIV (from just under 30 million in 2001 to about 33 million in 2007) is rising and most of the people living with HIV are in Sub-Saharan Africa. (Source: United Nations, The Millennium Development Goals Report 2008, 30 ).
::另一个问题是艾滋病毒/艾滋病的传播,在这方面取得了一些进展,新感染的人数从2001年的300万下降到2005年的270万,抗逆转录病毒治疗也导致死亡人数从2005年的220万减少到2007年的200万,长期存活意味着艾滋病毒感染者的人数正在增加(从2001年的不到3 000万增加到2007年的大约3 300万),大多数艾滋病毒感染者在撒哈拉以南非洲。 (资料来源:联合国,《2008年千年发展目标报告》,第30页)。Education in poor- and middle-income nations is improving. In 1991, about 80% of children in developing countries were enrolled in primary schools. In 2005, about 85% were. The comparable numbers in developed countries are about 95%. Enrollment rates taper off for high school (about 53% in 2005 in developing countries compared to 91% in developed countries). (Source: United Nations Development Program, Human Development Report 2007/2008 (New York: Palgrave Macmillan, 2007), 272. )
::贫困国家和中等收入国家的教育正在改善;1991年,发展中国家约80%的儿童上小学;2005年,约85%;发达国家的类似数字约为95%;中学入学率下降(2005年发展中国家约为53%,而发达国家为91%)。 (资料来源:联合国开发计划署,《2007/2008年人类发展报告》(纽约:Palgrave Macmillan,2007年),272。 )Unemployment
::失业失业Unemployment is pervasive in low-income nations. These nations, already faced with low levels of potential output, are producing well below their potential. Unemployment rates in low-income countries vary widely, reaching as high as 15% or more in some countries. If we count discouraged workers, people who have given up looking for work but who would take it if it were available, and people who work less than full time, not by choice but because more work is unavailable, then unemployment in low-income countries soars—often to more than 30%.
::低收入国家普遍失业。 这些国家已经面临低水平的潜在产出,其产量远远低于其潜力。 低收入国家的失业率差异很大,在一些国家高达15%或以上。 如果我们算上沮丧的工人,那些已经放弃寻找工作但如果有的话会接受工作的人,那些工作时间不足的人,不是通过选择,而是因为没有更多的工作,那么低收入国家的失业率会猛涨 — — 通常超过30%。Migration within low-income countries often contributes to unemployment in urban areas. Factors such as ethnic violence, poverty, and drought often force people to move from rural areas to cities, where unemployment rates are already high.
::低收入国家内的移徙往往导致城市地区失业,族裔暴力、贫穷和干旱等因素往往迫使人们从农村地区迁移到失业率已经很高的城市。Reliance on Agriculture
::依赖农业One of the dominant characteristics of poor nations is the concentration of employment in agriculture. Another is the very low productivity of that employment. Agriculture in low-income countries often employs a majority of the population but produces less than one-third of GDP.
::贫穷国家的主要特征之一是就业集中在农业,另一个特征是这种就业的生产率非常低,低收入国家的农业往往雇用大多数人口,但生产不到国内生产总值的三分之一。One of the primary forces behind income growth in wealthy countries has been the shift of labor out of agriculture and into more productive sectors such as manufacturing. This shift is also occurring in low-income nations but has lagged far behind.
::富裕国家收入增长背后的主要动力之一是劳动力从农业转向制造业等生产型部门。 这一转变也在低收入国家发生,但远远落在后面。The solution to these problems lies in economic development, to which we turn next.
::这些问题的解决在于经济发展,我们接下来将转向经济发展。Economic Development: A Definition
::经济发展:定义If the problems of low-income nations are pervasive, the development that helps to solve those problems must transform the very nature of their societies. The late Austrian economist Joseph Schumpeter described economic development as a revolutionary process. Whereas economic growth implies a quantitative change in production processes that are already familiar to the society, economic development requires a qualitative change in virtually every aspect of life.
::如果低收入国家的问题普遍存在,那么有助于解决这些问题的发展必须改变其社会本身的性质。 已故奥地利经济学家约瑟夫·舒彼得(Joseph Schumpeter)将经济发展描述为革命性进程。 经济增长意味着已经为社会所熟知的生产流程的数量变化,而经济发展则要求生活的各个方面发生质的变化。Viewpoint:
::视图点 :Robert Heilbroner, Between Capitalism and Socialism (New York: Vintage Books, 1970), 53–54.
::Robert Heilbroner,《资本主义与社会主义的关系》(纽约:旧书,1970年),53-54。"Economic development is political and social change on a wrenching and tearing scale. … It is a process of institutional birth and institutional death. It is a time when power shifts, often violently and abruptly, a time when old regimes go under and new ones rise in their places. And these are not just the unpleasant side effects of development. They are part and parcel of the process, the very driving force of change itself."Economic development transforms a nation at its core. But what, precisely, is development? Many definitions follow Heilbroner in noting the massive institutional and cultural changes economic development involves. Whatever the requirements of development, its primary characteristics are rising incomes and improving standards of living. That means output must increase—and it must increase relative to population growth. Because inequality is such a serious a problem in low-income nations, development must deliver widespread improvement in living conditions. Therefore, it seems useful to define economic development as a process that produces sustained and widely shared gains in per capita real GDP.
::经济发展改变了一个国家的核心。但是,确切地说,发展是什么?许多定义都遵循海尔布罗纳在指出经济发展涉及的大规模体制和文化变化时所遵循的定义。不管发展的要求是什么,其主要特征是增加收入和提高生活水平。这意味着产出必须增加,与人口增长相比,产出必须增加。由于不平等是低收入国家的一个严重问题,发展必须使生活条件得到普遍改善。因此,将经济发展定义为在人均实际国内生产总值方面产生持续和广泛共享收益的进程似乎是有益的。In recent years, the United Nations has constructed measures incorporating dimensions of economic development that go beyond the level of per capita GDP. The Human Development Index (HDI) includes three dimensions—life expectancy, educational attainment (adult literacy and combined primary, secondary, and post-secondary enrollment), as well as purchasing-power-adjusted per capita real GDP. The Gender Development Index (GDI) uses the same variables as the HDI but adjusts them downward to take into account the extent of gender inequality. A third index, the Human Poverty Index (HPI), measures human deprivation and includes such indicators as the percentage of people expected to die before age 40, the percentage of underweight children under age 5, the percentage of adults who are illiterate, and the percentage of people who live in poverty. The number reported for the HPI shows the percentage of people in the country who suffer these deprivations.
::近年来,联合国制定了一系列措施,将经济发展的方方面面纳入到人均国内生产总值的水平之外,人类发展指数包括三个方面——预期寿命、教育程度(成人识字和小学、中学和中学后综合入学)以及按购买力调整的人均实际国内生产总值;性别发展指数(GDI)使用与人类发展指数相同的变量,但将其下调,以考虑到两性不平等的程度;第三个指数,人类贫穷指数(HPI),衡量人类贫困状况,包括诸如预期40岁前死亡人口的百分比、5岁以下体重不足儿童的百分比、成人文盲的百分比和生活贫困人口的百分比等指标;人口发展指数(GDI)报告的数字显示该国遭受这些剥夺的人口的百分比。Table 1: "Human Development Index, Gender Development Index, and Human Poverty Index" shows the HDI, the GDI rank, and the HPI for selected countries, by HDI rank. The HDI is constructed to have an upper limit of 1. Canada’s HDI is 0.96; the United States’ is 0.95. As the table shows, the HDIs for developing countries range from 0.87 in Argentina to 0.34 in Sierra Leone. The greater the difference between the HDI and the GDI of a country, the greater the disparity in achievement between males and females in the country. Countries can have similar HDIs but different GDIs or HPIs. By looking at a variety of measures, we come closer to examining the extent to which the gains in income growth have been shared or not.
::表1: " 人类发展指数、性别发展指数和人类贫穷指数 " 表1按人类发展指数排名显示了人类发展指数、GDI等级和选定国家的HPI等级,人类发展指数的上限为1. 加拿大的人类发展指数为0.96;美国为0.95。如上表所示,发展中国家的人类发展指数从阿根廷的0.87到塞拉利昂的0.34不等,人类发展指数与一个国家的GDI之间的差距越大,该国男女的成绩差距就越大。各国可以拥有类似的人类发展指数,但不同的GDI或HPI。通过观察各种措施,我们更接近于审查收入增长收益的共享程度。Table 1: Human Development Index, Gender Development Index, and Human Poverty Index
::表1:人类发展指数、性别发展指数和人类贫穷指数HDI rank Country
::国家Human Development Index (HDI), 2005
::2005年人类发展指数(人类发展指数)Gender-Related Development Index (GDI) 2005, Rank
::2005年与性别有关的发展指数(GDI),2005年,级别Human Poverty Index (HPI), % 2005 The definition of deprivation for developed countries applies a higher standard than it does for developing countries. 1 Iceland 0.968 1 NA 2 Norway 0.968 3 6.8 4 Canada 0.961 4 10.9 10 France 0.952 7 11.2 12 United States 0.951 16 15.4 24 Greece 0.926 24 NA 32 Czech Republic 0.891 29 NA 38 Argentina 0.869 36 4.1 48 Costa Rica 0.846 47 4.4 61 Saudi Arabia 0.812 70 NA 67 Russian Federation 0.802 59 NA 70 Brazil 0.8 60 9.7 78 Thailand 0.781 71 10.0 81 China 0.777 73 11.7 84 Turkey 0.775 79 9.2 90 Philippines 0.771 77 15.3 94 Iran 0.759 84 12.9 101 Jamaica 0.736 90 14.3 105 Viet Nam 0.733 91 15.2 114 Mongolia 0.7 100 NA 117 Bolivia 0.695 103 13.6 126 Morocco 0.646 112 33.4 128 India 0.619 113 31.3 135 Ghana 0.553 117 32.3 136 Pakistan 0.551 125 36.2 148 Kenya 0.521 127 30.8 154 Uganda 0.505 132 34.7 156 Senegal 0.499 135 42.9 173 Mali 0.38 151 56.4 177 Sierra Leone 0.336 157 51.7 Source: United Nations Development Program, Human Development Report 2007/2008 (New York: Palgrave Macmillan, 2007).
Population Growth and Economic Development
::人口增长和经济发展It is easy to see why some people have become alarmists when it comes to population growth rates in developing nations. Looking at the world’s low-income countries, they see a population of more than 2 billion growing at a rate that suggests a doubling every 31 years. How will we cope with so many more people? The following statement captures the essence of widely expressed concerns:
::人们很容易理解为什么有些人在发展中国家的人口增长率问题上变得惊慌失措。 看一下世界低收入国家,他们看到20多亿人口以每31年翻一番的速度增长。 我们如何应对这么多人? 以下声明抓住了广泛表达的关切的实质:“At the end of each day, the world now has over two hundred thousand more mouths to feed than it had the day before; at the end of each week, one and one-half million more; at the close of each year, an additional eighty million. … Humankind, now doubling its numbers every thirty-five years, has fallen into an ambush of its own making; economists call it the “Malthusian trap,” after the man who most forcefully stated our biological predicament: population growth tends to outstrip the supply of food.
::“在每一天的尽头,现在世界还有超过20万张嘴要喂;在每星期的尽头,还有150万张嘴要喂;在每星期的尽头,还有85万张嘴;在每一年年底,又增加了8 000万张嘴。 ......人类现在每35年翻一番,已经陷入自己制造的埋伏之中;经济学家称它为“马尔图西亚陷阱 ” , 而最有力的人却说我们的生物困境:人口增长往往超过粮食供应。(Source: Phillip Appleman, ed., Thomas Robert Malthus: An Essay on the Principle of Population - Text, Sources, and Background, Criticism (New York: Norton, 1976), xi. )
:资料来源:Phillip Appleman编辑,Thomas Robert Malthus:关于人口原则的论文-文字、来源和背景、批评(纽约:Norton,1976年),xi.)
But what are we to make of such a statement? Certainly, if the world’s population continues to increase at the rate that it grew in the past 50 years, economic growth is less likely to be translated into an improvement in the average standard of living. However, the rate of population growth is not a constant; it is affected by other economic forces. This section begins with a discussion of the relationship between population growth and income growth, then turns to an explanation of the sources of population growth in low-income countries, and closes with a discussion of the Malthusian warning suggested in the quote above.
::但是,我们该怎么解释这一说法呢? 当然,如果世界人口继续以过去50年增长的速度增长,经济增长就不太可能转化为平均生活水平的改善。 但是,人口增长率并不是固定不变的,而是受到其他经济力量的影响。 本节首先讨论人口增长和收入增长之间的关系,然后解释低收入国家人口增长的来源,最后讨论上文引述的马尔修斯警告。Population Growth and Income Growth
::人口增长和收入增长On a simplistic level, the relationship between growth in population and growth in per capita income is clear. After all, per capita income equals total income divided by population. The growth rate of per capita income roughly equals the difference between the growth rate of income and the growth rate of population. Kenya’s annual growth rate in real GDP from 1975 to 2005, for example, was 3.3%. Its population growth rate during that period was 3.2%, leaving it a growth rate of per capita GDP of just 0.1%. A slower rate of population growth, together with the same rate of GDP increase, would have left Kenya with more impressive gains in per capita income. The implication is that if the developing countries want to increase their rate of growth of per capita GDP relative to the developed nations, they must limit their population growth.
::在简单化的层面上,人口增长与人均收入增长之间的关系是显而易见的。 毕竟,人均收入等于总收入除以人口。 人均收入的增长率大致等于收入增长率与人口增长率之间的差别。 比如,肯尼亚1975年至2005年的实际GDP年增长率为3.3 % 。 在此期间,肯尼亚的人口增长率为3.2 % , 人均GDP增长率仅为0.1 % 。 人口增长率的放缓,加上同样的GDP增长率,将使肯尼亚的人均收入增长更加令人印象深刻。 这意味着如果发展中国家想提高人均GDP相对于发达国家的增长率,它们就必须限制其人口增长率。Figure 3: "Population and Income Growth, 1975–2005" plots growth rates in population versus growth rates in per capita GDP from 1975 to 2005 for more than 100 developing countries. We do not see a simple relationship. Many countries experienced both rapid population growth and negative changes in real per capita GDP. But still others had relatively rapid population growth, yet they had a rapid increase in per capita GDP. Clearly, there is more to achieving gains in per capita income than a simple slowing in population growth. But the challenge raised at the beginning of this section remains: Can the world continue to feed a population that is growing exponentially—that is, doubling over fixed intervals?
::图3:“1975-2005年人口与收入增长”,100多个发展中国家从1975年到2005年的人口增长率与人均国内生产总值增长率之比。我们看不到一种简单的关系。许多国家经历了快速的人口增长和实际人均国内生产总值的负变化。但还有一些国家的人口增长率相对较快,但人均国内生产总值却迅速增长。显然,人均收入的增长比人口增长的简单放缓要多。但本节开头提出的挑战仍然是:世界能否继续养活一个人口指数性增长的人口,也就是说,在固定间隔内翻一番?Figure 3: Population and Income Growth, 1975–2005
::图3:1975-2005年人口和收入增长
A scatter chart of population growth rates versus GNP per capita growth rates for various developing countries for the period 1975–2005 suggests no systematic relationship between the rates of population and of income growth.
::1975-2005年期间各发展中国家人口增长率与人均国民生产总值增长率的分散图表明,人口增长率与收入增长率之间没有系统的关系。Source: United Nations Development Program, Human Development Report 2007/2008 (New York: Palgrave Macmillan, 2007).
The Malthusian Trap and the Demographic Transition
::马尔图西亚陷阱和人口过渡In 1798, Thomas Robert Malthus published his Essay on the Principle of Population. It proved to be one of the most enduring works of the time. Malthus’s fundamental argument was that population growth will inevitably collide with diminishing returns.
::1798年,托马斯·罗伯特·马尔修斯发表了《人口原则》的论文。 事实证明,这是当时最持久的作品之一。 马尔修斯的基本论点是人口增长不可避免地会与回报下降相冲突。Diminishing returns imply that adding more labor to a fixed quantity of land increases output but by ever smaller amounts. Eventually, Malthus concluded, increases in food production would be too small to sustain the increased number of human beings who consume that output. As the population continued to grow unchecked, the number of people would eventually outstrip the ability of the land to generate enough food. There would be an inevitable Malthusian trap, a point at which the world is no longer able to meet the food requirements of the population, and starvation becomes the primary check to population growth.
::回归的减少意味着在固定数量的土地上增加更多的劳动力会增加产量,但数量却越来越小。 最后,马尔萨斯的结论是,粮食生产的增加将太小,无法维持越来越多的消费产量的人。 随着人口继续不受限制地增长,人口数量将最终超过土地生产足够粮食的能力。 将不可避免地出现马尔图西亚陷阱,在这个关头,世界将不再能够满足人口的粮食需求,饥饿将成为人口增长的主要抑制因素。A Malthusian trap is illustrated in the graph below titled "The Malthusian Trap". We can determine the total amount of food needed by multiplying the population in any period by the amount of food required to keep one person alive. Because population grows exponentially, food requirements rise at an increasing rate, as shown by the curve labeled “Food required.” Food produced, according to Malthus, rises by a constant amount each period; its increase is shown by an upward-sloping straight line labeled “Food produced.” Food required eventually exceeds food produced, and the Malthusian trap is reached at time t1. The faster the rate of population growth, the sooner t1 is reached.
::以下题为“马尔图西亚陷阱”的图解说明了马尔图西亚陷阱。我们可以通过在任何时期将人口乘以维持一个人生存所需的粮食数量来确定所需要的粮食总量。由于人口成倍增长,因此粮食需求以不断增长的速度上升,如贴有“所需粮食”标签的曲线所示。 马尔图斯认为,生产的粮食每时每时增加一个不变数量;其增加表现为一条上行直线,标有“生产的粮食 ” 。 所需粮食最终超过生产的粮食,马尔图西亚陷阱在时间T1时达到。 人口增长速度越快,人口增长速度越快,人口增长速度就越快。The Malthusian Trap
::马尔图西亚陷阱
If the population grows at a fixed exponential rate, the amount of food required will increase exponentially. But Malthus held that the output of food could increase only by a constant amount each period. Given these two different growth processes, food requirements would eventually catch up with food production. The population hits the subsistence level of food production at the Malthusian trap, shown here at point T.
What Happens at the Malthusian Trap?
::马尔图西亚陷阱发生什么了?Clearly, there is not enough food to support the population growth implied by the “Food required” curve. Instead, people starve, and the population begins rising arithmetically, held in check by the “Food produced” curve. Starvation becomes the limiting force for the population; the population lives at the margin of subsistence. For Malthus, the long-run fate of human beings was a standard of living barely sufficient to keep them alive. As he put it, “the view has a melancholy hue.”
::显然,没有足够的粮食支持“食物需要”曲线所隐含的人口增长。 相反,人们挨饿,人口开始在算术上上升,并受到“食品生产”曲线的制约。 饥饿成为了人口的限制力量;人口生活在生存的边缘。 对于马尔萨斯来说,人类的长期命运是勉强维持生命的生活水平。 正如他所说 , “ 观点是忧郁的。 ”Happily, Malthus’s predictions do not match the experience of Western societies in the 19th- and 20th-centuries. One weakness of his argument is that he failed to take into account the gains in output that could be achieved through increased use of physical capital and new technologies in agriculture. Increases in the amount of capital per worker in the form of machines, improved seed, irrigation, and fertilization have made possible huge increases in agricultural output at the same time as the supply of labor was rising. Agricultural productivity rose rapidly in the United States over the last two centuries, just the opposite of the fall in productivity expected by Malthus. Productivity has continued to expand.
::幸运的是,马特斯的预测与西方社会在19世纪和20世纪的经验不符。 他的论点的一个弱点是,他没有考虑到通过增加实际资本和新技术在农业中的使用所能实现的产出增长。 以机器、改良种子、灌溉和肥化为形式的人均资本增长使得农业产出在劳动力供应增加的同时有可能大幅增长。 过去两个世纪,美国农业生产率迅速上升,与马特斯预期的生产率下降正好相反。 生产率持续扩大。Malthus was wrong as well about the relationship between population growth and income. He believed that any increase in income would boost population growth. But the law of demand tells us that the opposite may be true: higher incomes tend to reduce population growth. The primary cost of having children is the opportunity cost of the parents’ time in raising them—higher incomes increase this opportunity cost. Higher incomes increase the cost of having children and tend to reduce the number of children people want and thus to slow population growth.
::马尔萨斯对人口增长与收入之间的关系也是错误的。 他认为收入的任何增长都会促进人口增长。 但需求法告诉我们,情况可能恰恰相反:高收入会降低人口增长。 生育孩子的主要成本是父母抚养孩子的时间的机会成本 — — 高收入会增加这种机会成本。 高收入会增加生育孩子的成本,并会减少人们想要的孩子数量,从而减缓人口增长。Panel (a) of Figure 5: "Income Levels and Population Growth" shows the birth rates of low-, middle-, and high-income countries for the period 2000–2005. We see that the higher the income level, the lower the birth rate. Fewer births translate into slower population growth. In Panel (b), we see that high-income nations had much slower rates of population growth than did middle- and low-income nations over the last 30 years.
:Figure 5: Income Levels and Population Growth
::图5 图5:收入水平和人口增长
Source: World Development Indicators database, World Bank, revised October 17, 2008. Panel (a) shows that low-income nations had much higher total fertility rates (births per woman) during the 2000–2005 period than did high-income nations. In Panel (b), we see that low-income nations had a much higher rate of population growth during the 1975–2005 period.
An increase in a nation’s income can be expected to slow its rate of population growth. Hong Kong, for example, has enjoyed dramatic gains in income since the 1960s. Its birth rate and rate of population growth have fallen by over half during that time.
::一国收入的增长有望减缓其人口增长率。 比如,香港自1960年代以来在收入上取得了巨大增长。 在此期间,其出生率和人口增长率下降了一半以上。If economic development can slow population growth, it can also increase it. One of the first gains a developing nation can achieve are improvements in such basics as the provision of clean drinking water, improved sanitation, and public health measures such as vaccination against childhood diseases. Such gains can dramatically reduce disease and death rates. As desirable as such gains are, they also boost the rate of population growth. Nations are likely to enjoy sharp reductions in death rates before they achieve gains in per capita income. That can accelerate population growth early in the development process. Demographers have identified a process of demographic transition in which population growth rises with a fall in death rates and then falls with a reduction in birth rates.
::如果经济发展能够减缓人口增长,它也可以增加人口增长。发展中国家可以取得的第一个成就之一是改善诸如提供清洁饮用水、改善环境卫生和诸如儿童疾病疫苗接种等公共卫生措施等基本条件。这些成就可以大大减少疾病和死亡率。这些成就固然可取,但也提高了人口增长率。各国很可能在人均收入增长之前就享受死亡率的大幅度下降。这可以在发展进程初期就加速人口增长。人口统计学家已经确定了人口转型过程,人口增长率随着死亡率的下降而上升,然后随着出生率的下降而下降。The process of demographic transition has unfolded in a strikingly different manner in developed versus less developed nations over the past two centuries. In 1800, birth rates barely exceeded death rates in both developed and less developed countries. The result was a rate of population growth of only about 0.5% per year worldwide. By 1900, the death rate in developed nations had fallen by about 25%, with little change in the birth rate. Among developing nations, the birth rate was unchanged, while the death rate was down only slightly. The combined result was a modest increase in the rate of world population growth.
::在过去两个世纪中,发达国家与欠发达国家的人口结构转型进程以惊人的不同方式展开。在1800年,发达国家和发展中国家的出生率都略高于死亡率,其结果是全世界每年的人口增长率只有大约0.5 % 。到1900年,发达国家的死亡率下降了约25 % , 出生率变化不大。在发展中国家,出生率没有变化,而死亡率仅略微下降。总的结果是世界人口增长率略有上升。Changes were much more rapid in the 20th century. By 1965, the death rate among developed nations had plunged to about one-quarter of its 1800 level, while the birth rate had fallen by half. In developing nations, death rates took a similarly dramatic drop, while birth rates showed little change. The result was dramatic world population growth.
::到了1965年,发达国家的死亡率已经跌至1800年水平的四分之一左右,而出生率却下降了一半。 在发展中国家,死亡率也出现了类似的急剧下降,而出生率几乎没有变化。 结果是世界人口的急剧增长。The world’s high-income economies have completed the demographic transition. Less developed nations have begun to make progress, with birth rates falling by a slightly greater percentage than death rates. The results have been a sharp slowing in the rate of population growth among high-income nations and a more modest slowing among low-income nations. Continued slowing in population growth at all income levels is suggested in Figure 6: "The Demographic Transition at Work: Actual and Projected Population Growth".
::世界高收入经济体已经完成了人口结构转型。 欠发达国家已经开始取得进步,出生率下降比死亡率略高一点。 结果高收入国家的人口增长率急剧放缓,低收入国家的增长速度放缓幅度较小。 图6“工作人口结构转型:实际和预计人口增长”中建议所有收入水平的人口增长继续放缓。Between 1965 and 1980, the world population grew at an annual rate of 2%, suggesting a doubling time of 36 years. For the world as a whole, it is predicted that population growth will slow to a 1.1% rate during the 2005–2015 period, a rate that would imply a doubling time of 65 years.
::1965-1980年间,世界人口以年增长率2%的速度增长,这意味着时间翻了一番,为36年。 对整个世界来说,预计2005-2015年期间人口增长将放缓到1.1 % , 这意味着65年的时间将翻一番。Figure 6: The Demographic Transition at Work: Actual and Projected Population Growth
::图6:工作人口结构转型:实际和预计人口增长
Population growth has slowed considerably in the past several decades.
::在过去几十年中,人口增长大大放缓。Source: United Nations Development Program, Human Development Report 2007/2008 (New York: Palgrave Macmillan, 2007) for periods 1975–2000 and 2005–2015, United Nations Development Program, Human Development Report 1990 (New York, Oxford: Oxford University Press, 1990) for the 1960–1988 period, in which categories refer to low, middle, and high human development rankings.Case in Point: China Curtails Population Growth
::案例:中国角人口增长China is an example of a country that has achieved a very low rate of population growth and a very high rate of growth in per capita GNP.
::中国是一个人口增长率非常低、人均国民生产总值增长率很高的国家。China’s low rate of population growth represents a dramatic shift. As recently as the early 1970s, China had a relatively high rate of population growth; its population expanded at an annual rate of 2.7% from 1965 to 1973. By the 1980s, that rate had plunged to 1.5%. The World Bank reports a growth rate in China’s population of about 1% in the early part of the 21st-century.
::中国人口增长率低代表着巨大的变化。 近在20世纪70年代初,中国人口增长率相对较高;1965年至1973年,中国人口年增长率为2.7 % 。 到了20世纪80年代,中国人口增长率跌至1.5 % 。 世界银行报告21世纪初中国人口增长率约为1 % 。This dramatic drop in the population growth rate was brought about by a strict government policy by which couples are allowed to have only one child. Disincentives have been known to include fines, loss of employment, confiscation of property, demolition of homes, forced abortions, and sterilization. While the Chinese government has denied that forced abortions and sterilizations are part of its strategy, policies are administered locally, and all of the above means of coercion seem to have been employed at one time or another. If a woman who already has one child becomes pregnant, she will most likely be forced to have an abortion.
::人口增长率的急剧下降是由于政府实行严格的政策,允许夫妇只生育一个孩子,众所周知,抑制措施包括罚款、失业、没收财产、拆毁房屋、强迫堕胎和绝育。中国政府虽然否认强迫堕胎和绝育是其战略的一部分,但政策在当地实施,上述所有胁迫手段似乎都曾一度被使用。如果已经有一个孩子的妇女怀孕,她最有可能被迫堕胎。Although the policy has achieved its desired result—reduced population growth—it has had some horrible side effects. Given a strong cultural tradition favoring having a son, some couples resort to infanticide as a means of eliminating newborn daughters. When the sex of an unborn baby is determined to be female, abortion is common.
::虽然该政策取得了预期结果——人口增长率下降——但产生了一些可怕的副作用,由于强大的文化传统倾向于生一个儿子,一些夫妇将杀婴作为消灭新生女儿的手段,当未出生婴儿的性别被确定为女性时,堕胎是司空见惯的。The coercive aspects of China’s policies and their undesirable side effects have been condemned by many governments around the world, as well as by nongovernmental organizations. Declarations from United Nations’ conferences—the U.N. Conference on Population in Cairo in 1994 and the U.N. Conference on Women in Beijing in 1995—have emphasized that birth rates are linked to the economic conditions of women and that improving health, education, and employment opportunities for women constitutes a better and more humane way of reducing birth rates. Fearful that pro-democracy and human rights activists from other countries might stir up those movements locally, the Chinese government actually designed the 1995 Beijing Conference so as to minimize contact between Chinese and foreigners.
::中国政策的胁迫性方面及其不良副作用受到世界许多国家政府以及非政府组织的谴责。 联合国会议 -- -- 1994年在开罗举行的联合国人口问题会议和1995年在北京举行的联合国妇女问题会议 -- -- 的宣言强调出生率与妇女的经济状况有关,改善妇女的保健、教育和就业机会是降低出生率的更好和更人道的方式。 中国政府实际上设计了1995年北京会议,以尽量减少中国人和外国人之间的接触。There are signs, though, that Chinese officials may have heard the message. In a number of counties in China, experimental programs with slogans such as “Carry out Contraception and Family Planning Measures Voluntarily” are underway. The new approach to family planning emphasizes health care, education, and reduction in poverty to encourage women to have fewer children.
::但是,有迹象表明中国官员可能已经听到了这个信息。 在中国的一些县,正在推行“自愿出产避孕和计划生育措施”等口号的实验方案。 计划生育的新方针强调保健、教育和减贫,鼓励妇女少生孩子。International pressures may only be part of the reason for the emerging Chinese change of heart. In the late 1980s, Chinese officials discovered that the number of births in China was being underreported by about 30%. The aggressive policies may not have been as successful as they were cracked up to be.
::国际压力可能只是中国人改变心意的部分原因。 1980年代末,中国官员发现中国的出生人数报告不足约30%。 侵略政策可能没有那么成功。Labor Productivity and Economic Growth
::劳动生产率和经济增长Sustained long-term economic growth comes from increases in worker productivity, which essentially means how well we do things. In other words, how efficient is your nation with its time and workers? Labor productivity is the value that each employed person creates per unit of his or her input. The easiest way to comprehend labor productivity is to imagine a Canadian worker who can make 10 loaves of bread in an hour versus a U.S. worker who in the same hour can make only two loaves of bread. In this fictional example, the Canadians are more productive. Being more productive essentially means you can do more in the same amount of time. This, in turn, frees up resources to be used elsewhere.
::长期持续的经济增长来自工人生产率的提高,这实质上意味着我们如何做事情。换句话说,你的国家及其时间和工人的效率如何?劳动生产率是每个就业者按其投入单位创造的价值。理解劳动生产率的最简单方式是想象一个加拿大工人每小时能做10个面包面包,而一个美国工人在同一时间只能做两块面包。在这个虚构的例子中,加拿大人更富有生产力。生产率的提高基本上意味着你可以做同样多的时间。这反过来又释放出资源供其他地方使用。What determines how productive workers are? The answer is pretty intuitive. The first determinant of labor productivity is human capital. Human capital is the accumulated knowledge (from education and experience), skills, and expertise that the average worker in an economy possesses. Typically the higher the average level of education in an economy, the higher the accumulated human capital and the higher the labor productivity.
::如何决定生产性工人是什么样的?答案是相当直观的。 劳动生产率的第一个决定因素是人力资本。 人力资本是经济中普通工人所积累的知识(从教育和经验中获得的知识 ) 、 技能和专业知识。 典型地说,经济的平均教育水平越高,积累的人力资本就越高,劳动生产率也越高。The second factor that determines labor productivity is technological change. Technological change is a combination of invention—advances in knowledge—and innovation, which is putting that advance to use in a new product or service. For example, the transistor was invented in 1947. It allowed us to miniaturize the footprint of electronic devices and use less power than the tube technology that came before it. Innovations since then have produced smaller and better transistors that that are ubiquitous in products as varied as smart-phones, computers, and escalators. The development of the transistor has allowed workers to be anywhere with smaller devices. These devices can be used to communicate with other workers, measure product quality or do any other task in less time, improving worker productivity.
::确定劳动生产率的第二个因素是技术变革。技术变革是知识创新的发明-先进和创新的结合,它正在将这一进步用于新的产品或服务中。例如,晶体管是1947年发明的。它使我们能够将电子装置的足迹缩小化,并使用比之前的管子技术更少的功率。从那时以来,创新产生了较小和更好的晶体管,这些晶体管在智能电话、计算机和扶梯等各种产品中普遍存在。晶体管的发展使得工人可以在任何地方使用较小的装置。这些装置可以用来与其他工人交流,测量产品质量,或者在较短时间内做其他任何工作,提高工人的生产率。The third factor that determines labor productivity is economies of scale. Recall that economies of scale are the cost advantages that industries obtain due to size. Consider again the case of the fictional Canadian worker who could produce 10 loaves of bread in an hour. If this difference in productivity was due only to economies of scale, it could be that Canadian workers had access to a large industrial-size oven while the U.S. worker was using a standard residential size oven.
::影响劳动生产率的第三个因素是规模经济。 回顾规模经济是工业因规模而获得的成本优势。 重新考虑一个假设的加拿大工人的情况,他们每小时可以生产10个面包。 如果生产率的这一差异只是规模经济造成的,那么可能是加拿大工人在使用标准住宅规模烤箱时获得了大型工业用烤箱,而美国工人却使用标准住宅规模的烤箱。Sources of Economic Growth: The Aggregate Production Function
::经济增长来源:总生产职能To analyze the sources of economic growth, it is useful to think about a production function, which is the process of turning economic inputs like labor, machinery, and raw materials into outputs like goods and services used by consumers. A microeconomic production function describes the inputs and outputs of a firm, or perhaps an industry. In macroeconomics, the connection from inputs to outputs for the entire economy is called an aggregate production function.
::为了分析经济增长的来源,有必要思考生产功能,即将劳动力、机械和原材料等经济投入转化为消费者使用的商品和服务等产出的过程。 微观经济生产功能描述的是公司或产业的投入和产出。 在宏观经济学上,从投入到整个经济的产出之间的关联被称为综合生产功能。Components of the Aggregate Production Function
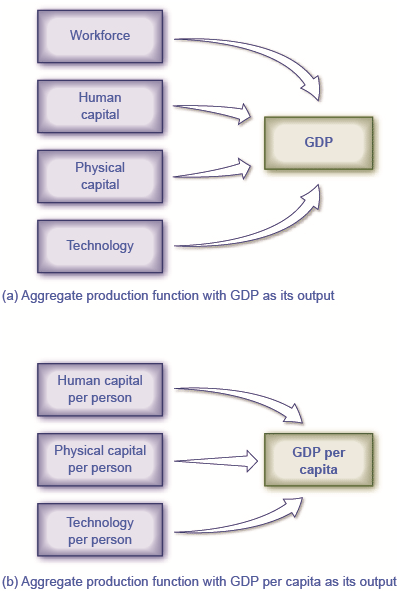
::生产总职能的组成部分Economists construct different production functions depending on the focus of their studies. 7 presents two examples of aggregate production functions. In the first production function, shown in 7 (a), the output is GDP. The inputs in this example are workforce, human capital, physical capital, and technology.
::经济学家根据其研究重点建立不同的生产功能。 7 7 提供了两个综合生产功能的例子。 在第一个生产功能(见7(a))中,产出为GDP。这个例子中的投入是劳动力、人力资本、实物资本和技术。Figure 7: Aggregate Production Functions
::图7 图7:总生产职能An aggregate production function shows what goes into producing the output for an overall economy. (a) This aggregate production function has GDP as its output. (b) This aggregate production function has GDP per capita as its output. Because it is calculated on a per-person basis, the labor input is already figured into the other factors and does not need to be listed separately.
Measuring Productivity
::衡量生产力An economy’s rate of productivity growth is closely linked to the growth rate of its GDP per capita, although the two are not identical. For example, if the percentage of the population who holds jobs in an economy increases, GDP per capita will increase but the productivity of individual workers may not be affected. Over the long term, the only way that GDP per capita can grow continually is if the productivity of the average worker rises or if there are complementary increases in capital.
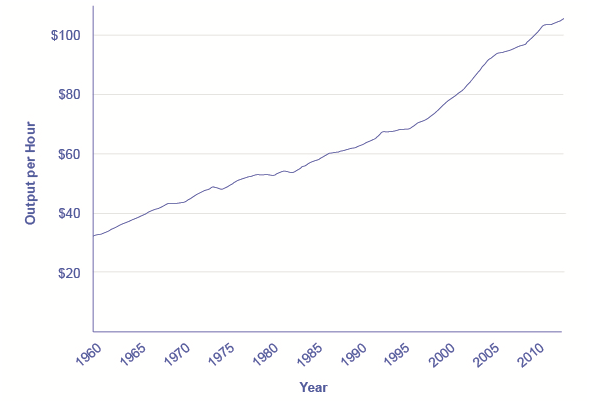
::生产率增长率与人均GDP增长率密切相关,尽管两者不尽相同。 比如,如果在经济中就业的人口比例增加,人均GDP将增加,但个体劳动者的生产率可能不会受到影响。 从长远看,人均GDP持续增长的唯一途径是平均劳动者的生产率提高或者资本的补充增长。A common measure of U.S. productivity per worker is dollar value per hour the worker contributes to the employer’s output. This measure excludes government workers, because their output is not sold in the market and so their productivity is hard to measure. It also excludes farming, which accounts for only a relatively small share of the U.S. economy. 8 shows that the average amount produced by a U.S. worker in an hour averaged over $100 in 2011, more than twice the amount an average worker produced per hour in 1966.
::衡量美国每个工人生产率的一个常见标准是工人对雇主产出贡献的每小时美元价值。 这一标准不包括政府工人,因为他们的产量没有在市场上出售,因此他们的生产率难以衡量。 它还不包括农业,农业只占美国经济的相对小部分。 8 表明2011年美国工人平均每小时生产100美元以上的平均产量比1966年平均工人每小时生产的数量高出一倍多。Figure 8: Output per Hour Worked in the U.S. Economy, 1947–2011
::图8:1947-2011年美国经济中每小时工作的产出(1947-2011年)Output per hour worked is a measure of worker productivity. In the U.S. economy, worker productivity rose more quickly in the 1960s and the mid-1990s compared with the 1970s and 1980s. However, these growth-rate differences are only a few percentage points per year. Look carefully to see them in the changing slope of the line. The average U.S. worker produced nearly $105 per hour in 2012. (Source: U.S. Department of Labor, Bureau of Labor Statistics.)
The “New Economy” Controversy
::“新经济”争议In recent years a controversy has been brewing among economists about the resurgence of U.S. productivity in the second half of the 1990s. One school of thought argues that the United States had developed a “new economy” based on the extraordinary advances in communications and information technology of the 1990s. The most optimistic proponents argue that it would generate higher average productivity growth for decades to come. The pessimists, on the other hand, argue that even five or ten years of stronger productivity growth does not prove that higher productivity will last for the long term. It is hard to infer anything about long-term productivity trends during the later part of the 2000s, because the steep recession of 2008–2009, with its sharp but not completely synchronized declines in output and employment, complicates any interpretation.
::近年来,经济学家们对1990年代后半期美国生产率的复苏产生了争议。 一种观点认为,美国已经根据1990年代通信和信息技术的非凡进步发展了“新经济 ” 。 最乐观的支持者认为这将在未来几十年中产生更高的平均生产率增长。 另一方面,悲观主义者则认为,即使是五年或十年的更强劲的生产率增长也不能证明生产率的提高将长期持续下去。 很难推断出2000年代后期的长期生产率趋势,因为2008-2009年的急剧衰退及其产出和就业的急剧但并非完全同步的下降使得任何解释都复杂化了。Productivity growth is also closely linked to the average level of wages. Over time, the amount that firms are willing to pay workers will depend on the value of the output those workers produce. If a few employers tried to pay their workers less than what those workers produced, then those workers would receive offers of higher wages from other profit-seeking employers. If a few employers mistakenly paid their workers more than what those workers produced, those employers would soon end up with losses. In the long run, productivity per hour is the most important determinant of the average wage level in any economy.
::生产力增长也与平均工资水平密切相关。随着时间推移,企业愿意向工人支付工资的数额将取决于这些工人生产的产出值。如果几个雇主试图向工人支付的工资低于这些工人的生产量,那么这些工人就会从其他追求利润的雇主那里得到更高的工资。如果几个雇主错误地向工人支付的工资高于这些工人的生产量,那么这些雇主很快就会亏损。从长远看,每小时的生产率是任何经济体平均工资水平的最重要决定因素。Comparing the Economies of Two Countries
::比较两个国家的经济体The Organization for Economic Co-operation and Development (OECD) tracks data on the annual growth rate of real GDP per hour worked. You can find these data on the OECD data webpage “Labour productivity growth in the total economy”.
::经济合作与发展组织(经合组织)跟踪关于实际国内生产总值每小时工作年增长率的数据,可在经合组织数据网页“整个经济的劳动生产率增长”上找到这些数据。Step 1. Visit the OECD website given above and select two countries to compare.
::步骤1. 访问上述经合组织网站,并选择两个国家进行比较。Step 2. On the drop-down menu “Variable,” select “Real GDP, Annual Growth, in percent” and record the data for the countries you have chosen for the five most recent years.
::步骤2. 在下调菜单“可变”中,选择“实际国内生产总值,年增长率,百分比”并记录你最近五年选择的国家的数据。Step 3. Go back to the drop-down menu and select “Real GDP per Hour Worked, Annual Growth Rate, in percent” and select data for the same years for which you selected GDP data.
::第3步,回到下调菜单,选择“每小时工作时间实际国内生产总值,年增长率,以百分比计算”,并选择相同年份的数据,并选择相同年份的国内生产总值数据。Step 4 . Compare real GDP growth for both countries.
::4. 将这两个国家的实际国内生产总值增长率进行比较。2 provides an example of a comparison between Australia and Belgium.
Australia
::澳大利亚 澳大利亚2008
2009
2010
2011
2012
Real GDP Growth (%)
::实际国内生产总值增长率(%)1.6%
2.1%
2.4%
3.3%
2.8%
Real GDP Growth/Hours Worked (%)
::实际国内生产总值实际增长率/工作时数(%)0.6%
2.1%
–0.2%
1.7%
2.4%
Belgium
::比利时 比利时2008
2009
2010
2011
2012
Real GDP Growth (%)
::实际国内生产总值增长率(%)1
–2.8
2.4
1.8
–0.3
Real GDP Growth/Hours Worked (%)
::实际国内生产总值实际增长率/工作时数(%)–1.2
–1.5
1.6
–1.1
–0.3
Step 5. Consider the many factors can affect growth. For example, one factor that may have affected Australia is its isolation from Europe, which may have insulated the country from the effects of the global recession. In Belgium’s case, the global recession seems to have had an impact on both GDP and real GDP per hours worked between 2008 and 2012.
::步骤5. 考虑许多因素可以影响增长,例如,澳大利亚可能受到影响的一个因素是它与欧洲的隔绝,欧洲可能使该国免受全球衰退的影响。 在比利时的例子中,全球衰退似乎对2008至2012年间的GDP和实际每小时GDP都产生了影响。Video: What is Sustainable Development?
::录像:什么是可持续发展?A simple introduction to sustainable development and the Sustainable Development Goals (SDGs).
::简单介绍可持续发展和可持续发展目标。The Power of Sustained Economic Growth
::持续经济增长的力量Nothing is more important for people’s standard of living than sustained economic growth. Even small changes in the rate of growth, when sustained and compounded over long periods of time, make an enormous difference in the standard of living. Consider 2, in which the rows of the table show several different rates of growth in GDP per capita and the columns show different periods of time. Assume for simplicity that an economy starts with a GDP per capita of 100. The table then applies the following formula to calculate what GDP will be at the given growth rate in the future:
::对于人们的生活水平来说,最重要的莫过于持续的经济增长。 即使是长期持续和复杂的增长率的微小变化,也会给生活水平带来巨大变化。 考虑2,表中各行显示的人均GDP增长率不同,各栏显示的时期也不同。 为了简单起见,假设经济开始时的人均GDP为100,然后用以下公式来计算未来特定增长率的GDP:GDP at starting date × (1 + growth rate of GDP) years = GDP at end date
::年 年 年 年 年 年 年 年 年 年 年 期 年 年 年 年 年 年 年 年 年 年 年 年 年 年 年 年 年 年 年 年 年 年 年 年 年 年 年 年 年 年 年 年 年 年 年 年 年 年 年 年 年 年 年 年 年 年 年 年 年 年 年 年 年 年 年 年 年 年 年 年 年 年 年 年 年 年 年 年 年 年 年 年 年 年 年 年 年 年 年 年 年 年 年 年 年 年 年 年 年 年 年 年 年 年 年 年 年 年 年 年 年 年 年 年 年 年 年 年 年 年 年 年 年 年 年 年 年 年 年 年 年 年 年 年 年 年 年 年 年 年 年 年 年 年 年 年 年 年 年 年 年 年 年 年 年 年 年 年 年 年 年 年 年 年 年 年 年 年 年 年 年 年 年 年 年 年 年 年 年 年 年 年For example, an economy that starts with a GDP of 100 and grows at 3% per year will reach a GDP of 209 after 25 years; that is, 100 (1.03) 25 = 209.
::例如,以国内生产总值100为起点、每年增长3%的经济在25年后将达到国内生产总值209,即100(1.03)25 = 209。The slowest rate of GDP per capita growth in the table, just 1% per year, is similar to what the United States experienced during its weakest years of productivity growth. The second highest rate, 3% per year, is close to what the U.S. economy experienced during the strong economy of the late 1990s and into the 2000s. Higher rates of per capita growth, such as 5% or 8% per year, represent the experience of rapid growth in economies like Japan, Korea, and China.
::该表的人均GDP增长率最慢,仅为每年1%,这与美国在生产率增长最弱的年份所经历的相似。 第二高的年增长率为3%,接近1990年代末至2000年代美国经济强劲时期的年增长率。 人均增长率较高,如每年5%或8%,反映了日本、韩国和中国等经济体快速增长的经验。3 shows that even a few percentage points of difference in economic growth rates will have a profound effect if sustained and compounded over time. For example, an economy growing at a 1% annual rate over 50 years will see its GDP per capita rise by a total of 64%, from 100 to 164 in this example. However, a country growing at a 5% annual rate will see (almost) the same amount of growth—from 100 to 163—over just 10 years. Rapid rates of economic growth can bring profound transformation. (See the following Clear It Up feature on the relationship between compound growth rates and compound interest rates.) If the rate of growth is 8%, young adults starting at age 20 will see the average standard of living in their country more than double by the time they reach age 30, and grow nearly sevenfold by the time they reach age 45.
::3 表明,经济增长率即使相差几个百分点,如果长期持续和复杂,也会产生深远的影响。 例如,50年中以每年1%的速度增长的经济体,其人均国内生产总值将总共增长64%,从100人增加到本例的164人。然而,以每年5%的速度增长的国家,其增长率(几乎)将达到同样水平——从100人增加到163人——仅10年以上。经济增长率的快速增长可以带来深刻的转变。 (关于复合增长率和复合利率之间关系的下文Clear I Up特征。 )如果增长率为8 % , 20岁的年轻人到30岁时,其国家的平均生活水平将翻一番以上,到45岁时将增长近7倍。-
Table 3: Growth of GDP over Different Time Horizons
Growth Rate
::增长率 增长率 增长率 增长率Value of an original 100 in 10 Years
::10年中原值100的10年中Value of an original 100 in 25 Years
::25年中原始价值为100的25年Value of an original 100 in 50 Years
::50年50年中原值100的价值1%
110
128
164
3%
134
209
438
5%
163
338
1,147
8%
216
685
4,690
Productivity
::生产力生产率Productivity is the value of what is produced per worker, or per hour worked. Productivity can be measured as the level of GDP per worker or GDP per hour. The United States experienced a productivity slowdown between 1973 and 1989. Since then, U.S. productivity has rebounded (the current global recession notwithstanding). It is not clear whether the current growth in productivity will be sustained. The rate of productivity growth is the primary determinant of an economy’s rate of long-term economic growth and higher wages. Over decades and generations, seemingly small differences of a few percentage points in the annual rate of economic growth make an enormous difference in GDP per capita. An aggregate production function specifies how certain inputs in the economy, like human capital, physical capital, and technology, lead to the output measured as GDP per capita.
::生产率是每个工人或每小时工作所生产的产品的价值。 生产率可以以每个工人或每小时的GDP水平来衡量。 美国在1973年至1989年期间经历了生产率下降。 从那时以来,美国生产率已经回升(尽管目前全球经济衰退 ) 。 目前生产率的增长能否持续还不清楚。 生产率增长率是经济长期经济增长和高工资率的首要决定因素。 几十年来,年经济增长率中似乎只有几个百分点的微小差异导致人均GDP的巨大差异。 总体生产功能明确了经济中某些投入(如人力资本、实物资本和技术 ) 如何导致以人均GDP衡量的产出。Compound interest and compound growth rates behave in the same way as productivity rates. Seemingly small changes in percentage points can have big impacts on income over time.
::复利和复利增长率表现与生产率相同。 百分点的微小变化可能长期对收入产生巨大影响。Video: Top 10 Highly Developed Countries
::视频:前10位高度发达国家Answer the self check questions below to monitor your understanding of the concepts in this section.
::回答下面的自我核对问题,以监测你对本节概念的理解。Self Check Questions
::自查问题1. Define the term developing country.
::1. 界定发展中国家这一术语。2. Identify where in the world most of the developing countries are located.
::2. 查明世界上大多数发展中国家位于何处。3. Give 10 examples of the types of problems that developing countries experience.
::3. 举10个例子,说明发展中国家所遇到的问题类型。4. What is the trade-off between developing countries and developed countries when it comes ot trade?
::4. 当涉及贸易时,发展中国家与发达国家之间的权衡取舍是什么?5. Which parts of the world are considered developed nations?
::5. 世界上哪些地区被视为发达国家?6. What are some of the most basic obstacles of development for Third World nations?
::6. 第三世界国家发展的一些最基本的障碍是什么?7. Because population growth can be an obstacle to economic development, what can a country do to lower the birth rate and raise life expectancy?
::7. 由于人口增长可能阻碍经济发展,一个国家可以做些什么来降低出生率和提高预期寿命?8. Explain how education and technology can help a nation move from a developing nation to a developed nation.
::8. 解释教育和技术如何帮助一个国家从发展中国家过渡到发达国家。9. Explain how religion can prevent economic development.
::9. 解释宗教如何能阻碍经济发展。10. How does corruption by a government prevent economic development?
::10. 政府腐败如何阻碍经济发展?11. What is the International Monetary Fund? What does it do?
::11. 国际货币基金组织是什么?它做什么工作?12. Go online and look up the International Monetary Fund and research what the IMF is working on right now.
::12. 上网查看国际货币基金组织,研究货币基金组织目前的工作。13. What is the World Bank? What does it do?
::13. 世界银行是做什么的?它做什么的?14. Go online and look up the World Bank. Research what the World Bank is working on right now.
::14. 上网查询世界银行,研究世界银行目前的工作。 -
Developing countries face a number of obstacles that make economic growth extremely difficult.