2.8地图投影
章节大纲
-
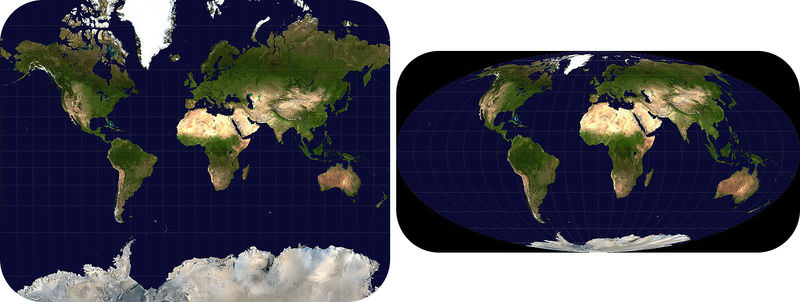
How does Greenland change size?
::格陵兰如何改变面积?Greenland does not change size! Different projections make Greenland appear to be a different size. The Mercator projection makes everything that is near the polar areas appear too large. The Mollweide projection distorts the size of the polar regions much less. To see the actual size of Greenland, look at a globe.
::格陵兰不会改变面积! 不同的预测使得格陵兰看起来是不同的面积。 Mercator的预测使得接近极地地区的一切看起来都太大了。 Mollweide的预测扭曲了极地地区的面积。 要看看格陵兰的实际面积,请看看一个地球。Map Projections
::地图预测Earth is a round, three-dimensional ball. In a small area, Earth looks flat, so it is not hard to make accurate maps of a small place. When mapmakers want to map the round Earth on flat paper, they use projections. What happens if you try to flatten out the skin of a peeled orange? Or if you try to gift wrap a soccer ball? To flatten out, the orange peel must rip, and its shape must become distorted. To wrap a round object with flat paper requires lots of extra cuts and folds. A projection is a way to represent Earth’s curved surface on flat paper ( Figure ).
::地球是圆的, 三维的球。 在一个小区域, 地球看起来平坦, 所以不难绘制小地方的精确地图。 当地图绘制者想要用平面纸绘制环地图时, 他们使用预测。 如果您试图平平橙色的皮肤, 会发生什么情况? 或者如果你想把足球包起来? 要平坦, 橙色的皮必须撕裂, 其形状必须扭曲。 用平面纸包裹圆圆的物体需要大量额外的切割和折叠。 投影是一种在平面上代表地球曲线表面的方法( 图 ) 。A map projection translates Earth's curved surface onto two dimensions.
::地图投影将地球弯曲的表面 转换成两个维度There are many types of projections. Each uses a different way to change three dimensions into two dimensions.
::预测有多种类型,每一种都采用不同的方式将三个维度改变为两个维度。There are two basic methods that the mapmaker uses in projections:
::制图师在预测中使用两种基本方法:- The mapmaker “slices” the sphere in some way and unfolds it to make a flat map. This is like flattening out an orange peel.
::地图绘制者“切片”以某种方式展示球体,并展示它来绘制平板地图。 这就像平整橙色皮。
- The mapmaker can look at the sphere from a certain point and then translate this view onto a flat paper.
::地图制作者可以从某一点看球体,然后将这个观点翻译为平面纸。
Let’s look at a few commonly used projections.
::让我们看看一些常用的预测。Mercator Projection
::Mercator 投射In 1569, Gerardus Mercator (1512-1594) ( Figure ) figured out a way to make a flat map of our round world. This is called the Mercator projection.
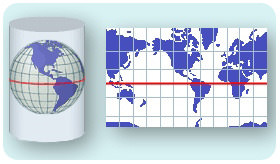
::1569年,Gerardus Mercator(1512-1594年)(图)想出一种方法来绘制我们圆环世界的平面地图。这叫做Mercator投影。Imagine wrapping the round, ball-shaped Earth with a big, flat piece of paper. First you make a tube or a cylinder. The cylinder touches Earth at the equator . The poles are the farthest points from the cylinder. Now shine a light from the inside of your model Earth out to the cylinder. The image projected onto the paper is a Mercator projection. Where does the projection represent Earth best? Where is it worst? Your map would be most correct at the equator. The shapes and sizes of continents become more stretched out near the poles. Early sailors and navigators found the Mercator map useful because most explorations were located near the equator. Many world maps still use the Mercator projection.
::想象一下圆环, 球形的地球, 圆形的纸块。 首先, 你制造一个管子或圆柱。 圆柱体在赤道地区触碰地球。 圆柱是圆柱体的最远点。 现在, 将光线从模拟地球的内部照射到圆柱体。 投在纸上的图像是Mercator 投影。 投影最能代表地球的位置是哪里? 最差的地方是哪里? 您的地图在赤道地区最正确。 大陆的形状和大小在极地附近越拉越大。 早期的水手和航海家发现Mercator 地图有用, 因为大多数勘探都位于赤道附近。 许多世界地图仍然使用Mercator 投影。A Mercator projection translates the curved surface of Earth onto a cylinder.
::Mercator投影将地球曲线表面转换为圆柱形。The Mercator projection is best within 15° north or south of the equator. Landmasses or countries outside that zone get stretched out of shape. The further the feature is from the equator, the more out of shape it is stretched. For example, if you look at Greenland on a globe, you see it is a relatively small country near the North Pole. But look at the Mercator projection above. Greenland looks almost as big the United States. Because Greenland is closer to the pole, the continent's shape and size are greatly increased. The United States is closer to its true dimensions. Why is this true?
::Mercator 投影最好在赤道以北或以南15度以内。 地块或该区以外的国家被展出形状。 地块越是从赤道延伸, 其形状就越是展出。 例如, 如果你看看地球上的格陵兰, 你就会看到它是一个相对小的国家, 靠近北极。 但是看看上面的Mercator 投影。 格陵兰看起来几乎和美国一样大。 由于格陵兰距离极近, 大陆的形状和大小也大增。 美国更接近其真实尺寸。 为什么这是真的?In a Mercator projection, all compass directions are straight lines. This makes it a good type of map for navigation. The top of the map is north, the bottom is south, the left side is west and the right side is east. However, because it is a flat map of a curved surface, a straight line on the map is not the shortest distance between the two points it connects.
::在Mercator 投影中,所有指南针方向都是直线。 这使得它成为一个很好的导航地图。 地图的顶部是北面, 底部是南面, 左侧是西面, 右侧是东面。 但是, 由于它是弯曲表面的平面地图, 地图上的直线并不是它连接的两个点之间的最短距离 。Conic Projection
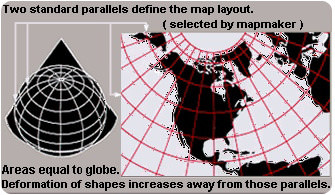
::二次曲线投射Instead of a cylinder, you could wrap the flat paper into a cone. Conic map projections use a cone shape to better represent regions near the poles ( Figure ). Conic projections are best where the cone shape touches the globe. This is along a line of , usually the equator.
::圆柱形, 而不是圆柱形, 您可以将平面纸包成圆锥体。 二次曲线地图投影使用锥形来更好地代表极附近的区域( 图表 ) 。 二次曲线投影是连接地球的锥形的最佳位置。 这是沿赤道线进行的, 通常是赤道线进行的 。A conic map projection wraps Earth with a cone shape rather than a cylinder.
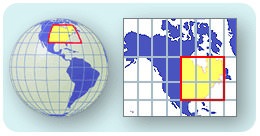
::二次曲线地图投影以锥形而不是圆柱形包绕地球。Gnomonic Projection
::Gnomonic 投射What if you want a different approach? Let's say you don't want to wrap a flat piece of paper around a round object. You could put a flat piece of paper right on the area that you want to map. This type of map is called a gnomonic map projection ( Figure ). The paper only touches Earth at one point. The sizes and shapes of countries near that point are good. The poles are often mapped this way to avoid distortion. A gnomic projection is best for use over a small area.
::如果您想要不同的方法呢? 不如假设您不想在圆对象周围环绕一个平面纸块。 您可以在您想要绘制的区域右方放置一张平面纸块。 这种类型的地图被称为“ 格诺米尼基地图投影 ” ( Figure ) 。 纸只在一个点上触及地球。 接近该点的国家的大小和形状是好的。 电线杆通常以这种方式绘制, 以避免扭曲。 基因投影最好用于小区域 。A gnomonic projection places a flat piece of paper on a point somewhere on Earth and projects an image from that point.
::地心投影将一块平板纸放在地球某处的某个点上, 从那个点投射出一个图像。Robinson Projection
::鲁滨逊投射In 1963, Arthur Robinson made a map with more accurate sizes and shapes of land areas. He did this using mathematical formulas. The formulas could directly translate coordinates onto the map. This type of projection is shaped like an oval rather than a rectangle ( Figure ).
::1963年,Arthur Robinson绘制了一张地图,地图的陆地面积和形状更加精确。他使用数学公式这样做。公式可以直接将坐标转换到地图上。这种类型的投影形状像奥瓦尔而不是矩形(图 ) 。A Robinson projection better represents the true shapes and sizes of land areas.
::鲁滨逊预测更好地代表了陆地面积的真正形状和大小。Robinson’s map is more accurate than a Mercator projection. The shapes and sizes of continents are closer to true. Robinson's map is best within 45° of the equator. Distances along the equator and the lines parallel to it are true. However, the scales along each line of latitude are different. In 1988, the National Geographic Society began to use Robinson’s projection for its world maps.
::鲁滨逊的地图比默卡托的预测更准确。 大陆的形状和大小接近真实。 鲁滨逊的地图最好在赤道的45度以内。 赤道沿线的距离和平行线是真实的。 然而,沿纬度每一行的尺度是不同的。 1988年,国家地理学会开始使用鲁滨逊的预测绘制世界地图。Summary
::摘要- A map projection is a way to show a three-dimensional figure in two dimensions.
::地图投影是一种在两个维度显示三维图的方法。
- All map projections have some distortion. Different types have distortions in different locations and of different amounts.
::所有地图预测都有一些扭曲,不同类型在不同的地点和不同数量上都有扭曲。
- Robinson's project is different from the rest because it uses mathematical formulas. Other projections are best at one point.
::鲁滨逊的项目与其他项目不同,因为它使用数学公式。其他预测最好在某一点。
Review
::回顾- Why does a map projection distort Earth's features? Where does it distort the features most?
::为什么地图投影会扭曲地球的特征?它在哪里扭曲最强的特征?
- Which type of projection is best for someone interested in studying Greenland? The worst?
::哪种预测对有兴趣研究格陵兰的人最好?
- Why would the Mercator projection have been okay for use in the 16th century?
::为什么Mercator的投影 在16世纪可以被使用?
Explore More
::探索更多Use the resource below to answer the questions that follow.
::利用以下资源回答以下问题。- How is making a map of Earth like trying to flatten an orange peel? What problems occur when making a map of Earth?
::如何绘制地球地图就像试图平平橙皮一样? 绘制地球地图时会有什么问题?
- What is the choice you need to make when you create or use a map of the world?
::当你创建或使用世界地图时,你需要做出什么选择?
- In a Mercator Projection, what is accurate and what isn’t? What was a Mercator map made to be able to do?
::在Mercator投影中,什么是准确的,什么不是准确的? Mercator地图是用来做什么的?
- In Lambert’s Cylindrical Projection, where is the distortion greatest? What is good? What is distorted?
::在兰伯特的圆柱投影中,哪里是最大的扭曲?什么是好的?什么是扭曲的?什么是扭曲的?
- In the Winkel Tripel Projection, what are the three things that need to be compromised?
::在温克尔三重投影中,需要妥协的三件事是什么?
- What is a Dymaxion Projection good at showing and what is it commonly used for?
::高压投影有什么好显示的? 它通常用于什么?
- What is the best type of map?
::地图的最佳类型是什么?
- The mapmaker “slices” the sphere in some way and unfolds it to make a flat map. This is like flattening out an orange peel.