2.3 即时速速率
章节大纲
-
In a footrace such as the one shown here, the initial of a runner is zero. The runner increases their velocity out of the starting blocks and their velocity continues to increase as the race proceeds. For the well-trained athlete, their highest velocity is maintained through the finish line.
::在像这里所显示的脚步中, 赛跑者最初是零。 赛跑者提高了他们离开起始区的速度, 随着赛跑的进行, 速度也继续加快。 对于训练有素的运动员来说, 他们的最高速度通过终点线保持。Instantaneous Velocity
::即时速速率The instantaneous velocity of an object is the velocity of the object at a given moment. If the object is moving with constant velocity, then the instantaneous velocity at every moment, the , and the constant velocity are all the same.
::对象的瞬时速度是特定时刻天体的速度。如果天体以恒定速度移动,那么瞬时速度和恒定速度都是一样的。Position vs Time Graphs
::位置与时间图Consider a position versus time graph for an object starting at and that has a constant velocity of 80. m/s.
::以 t=0 和 x=0 开始的物体,其恒定速度为80 m/s, 其位置与时间图比较。The velocity of an object can be found from a position vs time graph. On a position vs time graph, the displacement is the vertical separation between two points and the time interval is the horizontal separation. The ratio of displacement to time interval is the average velocity. This ratio is also the slope of the line. Therefore, the slope of the straight line is the average velocity. For the motion pictured above,
::从位置和时间图中可以找到对象的速度。在位置和时间图中,位移是两个点之间的垂直分隔,时间间隔是水平分隔。位移与时间间隔的比例是平均速度。这个比例也是线的斜度。因此,直线的斜度是平均速度。对于以上所绘制的动作,
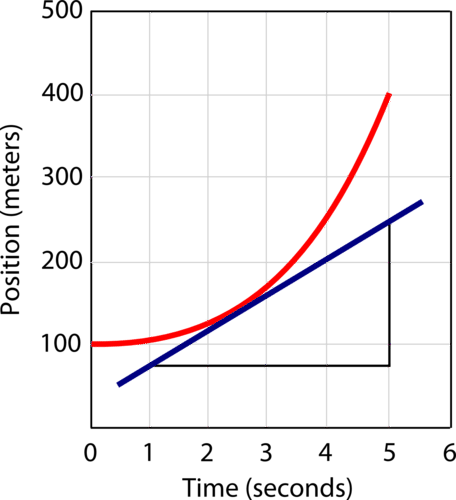
::m5.0 s=80. m/sFor accelerated motion (the velocity is constantly changing), the position vs time graph will be a curved line. The slope of the curved line at any point is the instantaneous velocity at that time. If we were using calculus, the slope of a curved line could be calculated. Without calculus, we approximate the instantaneous velocity at a particular point by laying a straight edge along the curved line and estimating the slope.
::对于加速动作( 速度在不断变化) , 位置和时间图将会是一条曲线线。 曲线线在任何一点的斜度都是当时的瞬时速度。 如果我们使用微积分, 可以计算曲线线的斜度。 没有微积分, 我们通过沿着曲线线直倾并估计斜度来接近某一点的瞬时速度 。In the image above, the red line is the position vs time graph and the blue line is an approximated slope for the line at . The rise for this slope is approximately 170 m and the time interval (run) is 4.0 seconds. Therefore, the approximated slope is 43 m/s.
::在以上图像中,红线是相对于时间图的方位,而蓝色线是t=2.5秒线的近似斜坡。该斜坡的升幅约为170米,时间间隔(运行)为4.0秒。因此,近似斜坡为43米/秒。Swimming is another sport in which the velocity of the swimmer is constantly changing over time. In simulation below, adjust the sliders to change the swimmer’s expertise in the Butterfly Stroke. Then, try to derive the instantaneous velocity of the swimmer at various points in the race using the position-time graph:
::游泳是游泳运动员速度随时间变化的另一种运动。 在下面的模拟中,调整滑板以改变游泳运动员在蝴蝶运动中的专门知识。 然后,尝试利用位置-时间图在比赛的各个点得出游泳运动员的瞬时速度:Summary
::摘要-
The slope of a position versus time graph is the velocity.
::位置和时间图的斜坡是速度。 -
For constant velocity motion, the slope gives the constant velocity, the average velocity, and the instantaneous velocity at every point.
::对于恒定速度运动,斜坡给出每个点的恒定速度、平均速度和瞬时速度。 -
For constant acceleration motion, the slope of the position versus time curve at a particular point gives the instantaneous velocity at that point.
::对于恒定加速运动,位置与时间曲线在某一点的斜坡给出了当点的瞬时速度。
Review
::回顾Draw a velocity versus time graph for an object whose constant velocity is 15 m/s and whose position starts at when . Graph the motion for the first 5.0 seconds.
::为恒定速度为 15 m/s 且其位置从 x=0 开始为 t=0 的物体绘制速度与时间图。 绘制第一个 5. 0 秒的动作图 。Use the graph below to answer the following questions:
::使用下图回答下列问题:-
For the motion graphed in the position versus time graph shown above, what is the average velocity in the time interval 1 to 3 seconds?
::以上所显示的位置和时间图所显示的动作,时间间隔1至3秒的平均速度是多少? -
For the motion graphed in the position versus time graph shown above, what is the average velocity in the time interval 3 to 4 seconds?
::对于在以上所显示的位置和时间图中绘制图解的运动,时间间隔3至4秒的平均速度是多少? -
For the motion graphed in the position versus time graph shown above, what is the average velocity in the time interval 5 to 6 seconds?
::以上所显示的位置和时间图所显示的动作,5至6秒时间间隔的平均速度是多少?
Explore More
::探索更多Use this resource to answer the questions that follow.
::使用此资源回答下面的问题 。-
In the graph on the video, what is graphed on the vertical axis?
::在视频的图表中,什么是垂直轴上的图表? -
What is graphed on the horizontal axis?
::水平轴上的图表是什么? -
What does the slope of this graph represent?
::此图的斜坡代表什么 ?
-
The slope of a position versus time graph is the velocity.