3.13 绘制两个变量线性不平等图
章节大纲
-
The maximum load in an elevator is 2,500 pounds. If the average child weighs 70 pounds and the average adult weighs 180 pounds, what combinations of children and adults can ride the elevator so that their weight is less than 2,500 pounds? 1 The words "is less than" imply an inequality . In this section, we consider inequalities that are linear.
Graphing Linear Inequalities
::线性不平等Linear inequalities are inequalities of the form:
::线性不平等是形式上的不平等:
::y < mx+by=mx+by=mx+b > y <mx+b > > y <mx+b > >Notice we have used a form similar to slope-intercept form . What makes these inequalities linear is that a line bounds one side of the region where there are solutions. So, the is the of the line that bounds the region and the is the y -coordinate of the y - intercept of that line.
::我们使用了类似于斜坡界面的表格。 导致这些不平等线性的是线性线将存在解决方案的区域的一面隔开。 因此, m 是连接区域的线的一面, b 是该线的 Y 界面的 Y 坐标 。Graphing the boundary line is how we will start to graph a linear inequality. If the inequality is in the form or , the line will be dotted or dashed because the points on the line are not part of the solution. If the line is in the form or , the line will be solid to indicate that the points on the line are included in the solution.
::绘制边界线是我们如何开始绘制线性不平等的图。 如果不平等以 y < mx+b 或 y>mx+b 的形式出现, 则由于线性点不是解决方案的一部分, 线性线性线性将被点点点或折叠。 如果线性线性线性点是 y=mx+b 或 y=mx+b, 线性线性线性线性线性线性线性线性线性线性线性线性线性线性线性线性线性线性线性线性线性线性线性线性线性线性线性线性线性线性线性线性线性线性线性线性线性线性线性线性线性线性线性线性线性线性线性线性线性线性线性线性线性线性线性线性线性线性线性线性线性线性线性线性线性线性线性线性线性线性线性线性线性线性线性线性线性线性线性线性线性线性线性线性线性线性线性线性线性线性线性线性线性线性线性线性线性线性线性线性线性线性线性线性线性线性线性线性线性线性线性线性线性线性线性线性线性线性线性线性线性线性线性线性线性线性线性线性线性线性线性线。Because these are inequalities, the line is only a boundary for the solution. The solution can also include points either below the line or above the line. Since there are an infinite number of points that can be solutions, we shade the region of the graph that contains those points to indicate they are solutions.
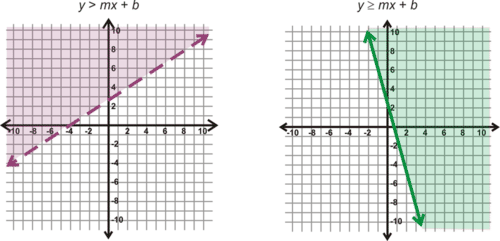
::由于这些是不平等, 这条线只是解决方案的边界。 解决方案还可以包括线下或线上方的点。 由于有无限数量的点可以作为解决方案, 我们给包含这些点的图表区域抹上阴影, 以表明它们是解决方案 。If the inequality is in the form or , the shading will be below the line.
::如果不平等以 y < mx+b 或 y=mx+b 的形式出现,则阴影将位于线下。If the inequality is in the form or , the shading will be above the line.
::如果不平等以 y>mx+b 或 y'mx+b 的形式存在,则阴影将位于线条之上。Since it is not always clear what constitutes "above" or "below" the line, it is helpful to use a test point to check which side of the line needs to be shaded.
::由于并不总是清楚什么是“高于”或“低于”这条线,因此使用一个测试点来检查线的哪一侧需要阴影是有用的。How to Graph Linear Inequalities of Two Variables
::如何绘制两个变量的线性不平等1. Graph the boundary line. If the inequality is < or >, then the line is dotted or dashed. If the inequality is or , then the line is solid.
::1. 绘制边界线。如果不平等是 < 或 > ,则该边界线是虚线或虚线。如果不平等是 _ 或 _ ,则该边界线是固线。2. To determine which side of the boundary line to shade, choose a test point on one side of the line.
::2. 确定边界线的哪个侧面为阴影,在边界线的一边选择一个试验点。3. Substitute the values from the test point in the inequality to see if the inequality is true or false. If the inequality is true for the test point, shade the side of the boundary line that includes the test point. If the inequality is false for the test point, shade the side of the boundary line that does not include the test point. Shade by hand by drawing lines perpendicular to the boundary line.
::3. 以不平等试验点的数值替代不平等试验点的数值,看不平等是真实的还是虚假的;如果试验点的不平等是真实的,则以包括试验点的边界线的侧面为阴影;如果试验点的边界线上的不平等是虚假的,则以不包括试验点的边界线的侧面为阴影。Example 1
::例1Graph .
::图x____________________________________________________________________________________________________________________________________________________________________________________________________Solution: First, we graph the boundary line: . Since the inequality is greater than or equal to , we draw the line as a solid line. Then, we choose a test point, say (4,5). 4 is the x-value, so to check whether (4,5) is a solution to we substitute 4 for : . This is true, so we shade the side of the line that (4,5) is on, the right side.
::解答: 首先, 我们绘制边界线 : x=3. 由于不平等大于或等于, 我们将线划为一条固线。 然后, 我们选择一个测试点, 比如 (4, 5) 。 4 是 x 值, 以便检查 x 3 的解决方案( 4, 5) 是否是 x 3 的解决方案, 我们替换 4 : 4, 3 。 这是真的, 因此我们把线的右边( 4, 5) 的侧面遮上 。
Notice that this is "above" the line because the x-values to the right are greater than 3.
::注意这是“ 高于” 线条, 因为右侧的 X 值大于 3 。by MathWOEs demonstrates how to determine which direction to shade the graphs of linear inequalities.
::以数学、数学、经济学、经济学、经济学、经济学、经济学、数学、经济学、数学、经济学、数学、经济学、数学、数学、经济学、数学、数学、数学、经济学、数学、数学、经济学、数学、数学、经济学、数学、经济学、数学、数学、经济学、数学、经济学、数学、数学、经济学、数学、经济学、数学、数学、经济学、数学、经济学、数学、经济学、经济学、数学、数学、经济学、经济学、数学、数学、经济学、经济学、数学、数学、经济学、经济学、经济学、数学、经济学、数学、经济学、经济学、数学、经济学、数学、经济学、数学、经济学、数学、经济学、数学、经济学、数学、经济学、经济学、数学、经济学、经济学、经济学、数学、经济学、经济学、数学、经济学、经济学、经济学、经济学、经济学、经济学、经济学、经济学、经济学、经济学、经济学、经济学、经济学、经济学、经济学、经济学、经济学、经济学、经济学、经济学、经济学、经济学、经济学、经济学、经济学、经济学、经济学、经济学、经济学、经济学、经济学、经济学、经济学、经济学、经济学、经济学、经济学、经济学、经济学、经济学、经济学、经济学、经济学、经济学、经济学、经济学、经济学、经济学、经济学、经济学、经济学、经济学、经济学、经济学、经济学、经济学、经济学、数学、经济学、经济学、经济学、经济学、经济学、经济学、经济学、经济学、经济学、经济学、经济学、经济学、经济学、经济学、经济学、经济学、经济学、经济学、经济学、经济学、经济学、经济学、经济学、经济学、经济学、经济学、经济学、经济学、经济学、经济学、经济学、经济学、经济学、经济学、经济学、经济学、经济学、经济学、经济学、经济学、经济学、经济学、经济学、经济学、经济学、经济学、经济学、经济学、经济学、经济学、经济学、经济学、经济学、经济学、经济学、经济学、经济学、经济学、经济学、经济学、经济学、经济学、经济学、经济学、经济学、经济学、经济学、经济学、经济学、经济学、经济学、经济学、经济学、经济学、经济学、经济学、经济学、经济学、经济学、经济学、经济学、经济学、经济学、经济学、经济学、经济学、经济学、经济学、经济学、经济学、经济学、经济学、经济学、经济学、经济学、经济学、经济学、经济学、经济学、经济学、经济学、经济学、经济学、经济学、经济学、经济学、经济学、经济学、经济学、经济学、经济学、Example 2
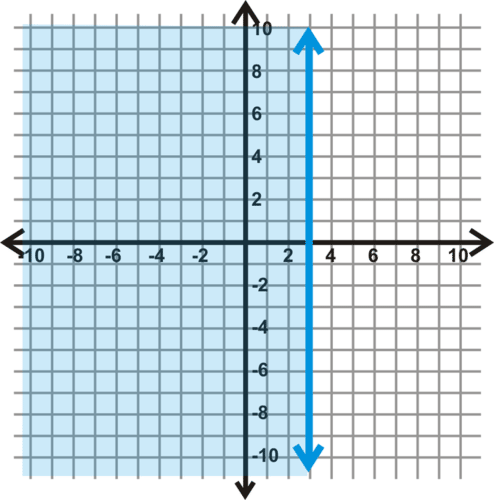
::例2Graph .
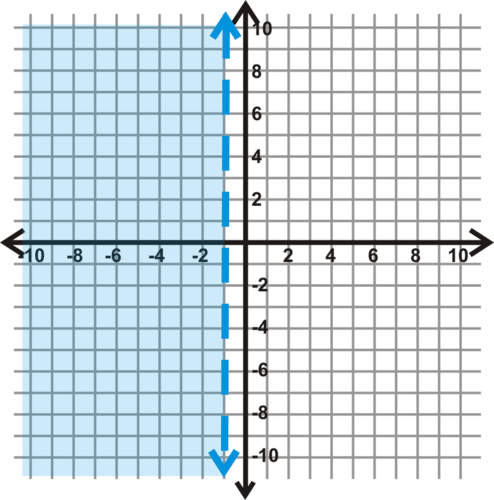
::图 x% 1 。Solution: Here w e will have a vertical dashed line at . Then, the shading will be to the left of the dashed line because that is where will be less than -1.
::解答: 这里我们将在 x\\\\ 1 处有一个垂直破折线。 然后, 阴影将位于破折线左侧, 因为这里 x 将低于 - 1 。Example 3
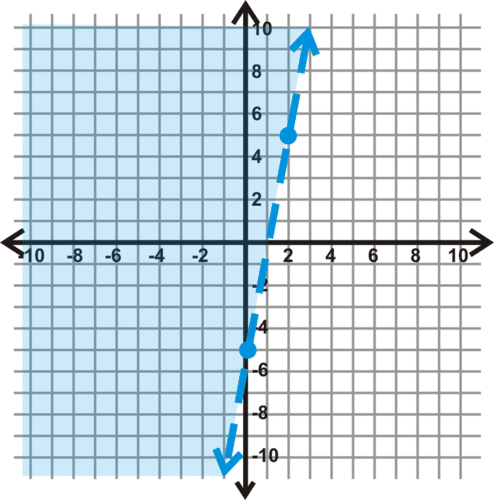
::例3Graph .
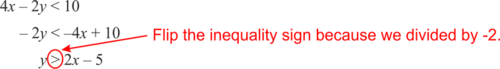
::图4x-2y < 10。Solution: First, change the inequality into slope-intercept form. Remember that if you have to divide or multiply by a negative number, you must flip the inequality sign.
::解决方案 : 首先, 将不平等改变为斜坡拦截形式 。 记住, 如果您需要除以或乘以负数, 您必须翻转不平等符号 。Now, graph the boundary line. Plot . The line will be dashed because of the greater than sign.
::现在, 请绘制边界线 。 绘制 y= 2x- 5 。 该线将因比符号大而被冲破 。Now, we need to determine the shading. You can use one of two methods to do this. The first way is to use the graphs and forms from above. The equation , in slope-intercept form, matches up with the purple dashed line and shading. Therefore , we should shade above the dashed blue line.
::现在,我们需要确定阴影。 您可以使用两种方法中的一个方法来做到这一点。 第一个方法是使用上面的图表和表单。 方程式, 以斜坡界面的形式, 与紫色破折线和阴影相匹配。 因此, 我们应该在破折的蓝线上方阴影 。The alternate method would be to test a point to see if it is a solution to the inequality. If a point makes the inequality true, then the shading is on that side of the line. If we pick (-5, 0), the inequality yields , which tells us that our shading is correct.
::另一种方法是测试一个点以确定它是否解决了不平等问题。 如果一个点将不平等问题变为真实,那么阴影就在线的那一端。 如果我们选择( 5, 0) , 不平等就会产生 - 20 < 10, 这告诉我们我们的阴影是正确的。by Mathispower4u demonstrates how to graph linear inequalities.
::由 Mathispower4u 演示如何绘制线性不平等图。Example 4
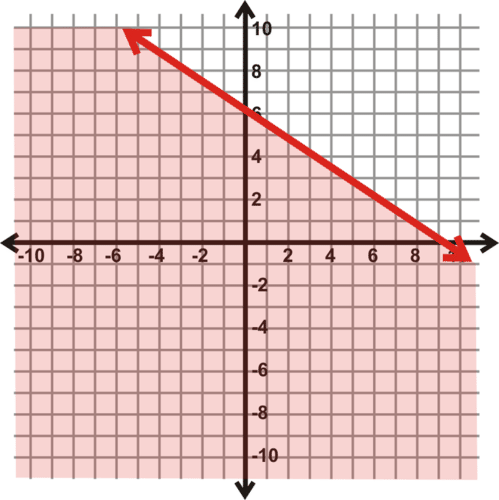
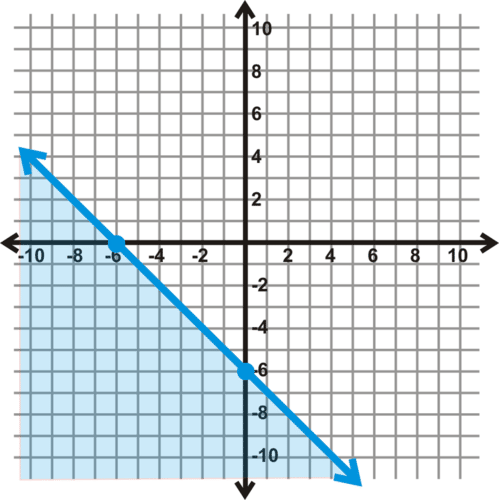
::例4Graph .
::图y23x+6。Solution: This inequality is already in slope-intercept form. So, graph the line, which will be solid, and then determine the shading. Looking at the example graphs above, this inequality should look like the red inequality, so shade below the line.
::解决方案 : 此不平等已经以斜坡界面的形式出现。 因此, 请绘制线条图, 线条将坚固, 然后决定阴影。 查看上面的示例图, 这种不平等应该看起来像红色的不平等, 因此在线下阴影 。Test a point to make sure our shading is correct. An easy point in the shaded region is (0, 0). Plugging this into the inequality, we get , which is true.
::测试点可以确保我们的阴影是正确的。 阴影区域的一个简单点是( 0, 0 ) 。 将它融入不平等, 我们得到的就是0, 6, 这是正确的 。Example 5
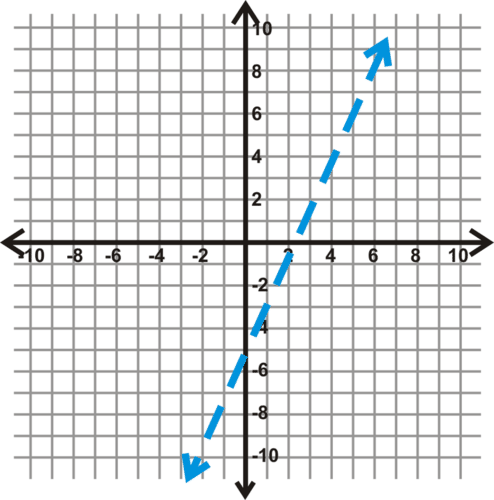
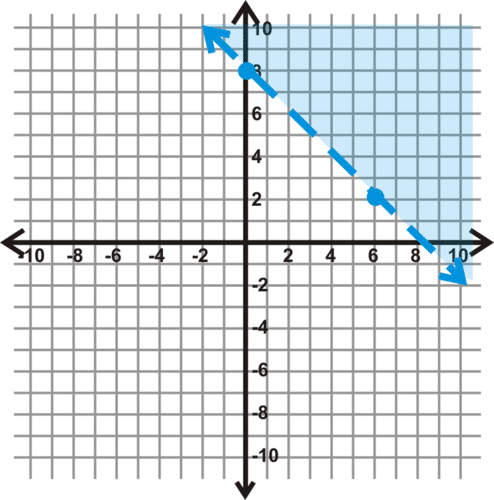
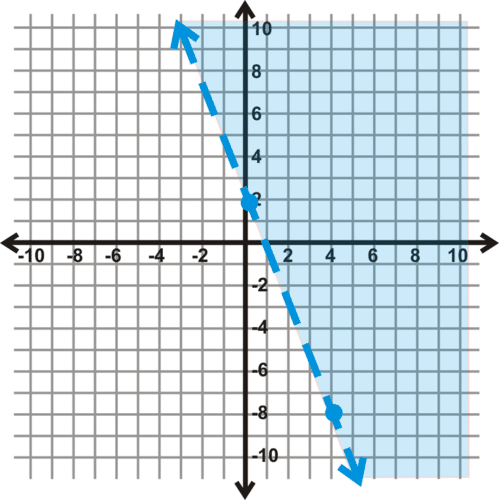
::例5Determine the linear inequality that is graphed below.
::确定线性不平等,如下图所示。Solution: First, find the equation of the line. The given points on the line are (0, 8) and (6, 2) (from the points drawn on the graph). This means that the y- intercept is (0, 8). Then, we find the slope using rise over run : we go down 6 units and go to the right 6 units to get to (6, 2). This means the slope is or -1. Because we have a dotted line and the shading is above, our sign will be the > sign. Putting it all together, the equation of our linear inequality is .
::解答 : 首先, 找到线的方程式 。 线上的给定点是 (0, 8) 和 (6, 2) 。 这意味着 y 接口是 (0, 8) 。 这意味着 y 接口是 (0, 8) 。 然后, 我们发现 斜坡 使用 向上运行 : 我们往下 6 个单位, 往右 6 个单位去 到达 (6, 2) 。 这意味着 斜坡是 - 66 或 - 1 。 因为我们有一个虚线, 阴影在上方, 我们的标志就是 > 符号 。 把它们加在一起, 我们线性不平等的方程式是 y x+ 8 。How to Graph Linear Inequalities With Desmos
::如何用脱mos 来绘制线性不平等The steps for graphing a linear inequality are similar to graphing a linear equation .
::线性不平等的图形化步骤与线性方程式的图形化步骤相似。1. Solve for the dependent variable , usually y , in the inequality.
::1. 解决不平等中的依附变量,通常是y。2. Type the inequality into Desmos . To select an equation use the keyboard menu in the lower left corner. (You have to hover the cursor over the equal sign and then press ENTER to get other symbol options).
::2. 将不平等键入 Desmos 。 要选择公式, 请在左下角使用键盘菜单 。 (您必须在相等符号上悬停光标, 然后按 ENTER 键以获取其他符号选项 )。3. The graph will generate automatically.
::3. 图表将自动生成。
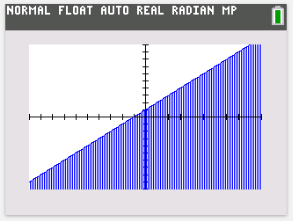
How to Graph Linear Inequalities With a TI-83/84
::如何用TI-83/84来表示线性不平等。The steps for graphing a linear inequality are similar to graphing a linear equation.
::线性不平等的图形化步骤与线性方程式的图形化步骤相似。1. Solve for the dependent variable, usually y , in the inequality.
::1. 解决不平等中的依附变量,通常是y。2. Type the inequality into the graphing utility. To select an equation use the keyboard menu in the lower left corner. (You have to hover the cursor over the equal sign and then ENTER caps to get other symbol options).
::2. 将不平等键入图形工具。要选择公式,请使用左下角的键盘菜单。 (必须在等号上悬浮光标,然后是 ENTER 盖,以获得其他符号选项)。3. Press GRAPH.
::3. 按GRAPH。Summary
::摘要-
To graph linear inequalities, graph the boundary line. If the inequality is > or <, then the line will be dashed. If the inequality is
or
, then the line is solid.
::要绘制线性不平等图,请绘制边界线图。如果不平等为 > 或 < ,则线将被冲破。如果不平等为 _ 或 _ ,则线是固态的。 -
Next, determine which region is included in the solution by using a test point.
::下一步,通过使用试验点确定解决办法包括哪个区域。
Review
::回顾Graph the following inequalities.
::如下图所示的不平等情况。1.
::1. y=02.
::2. x63.
::3. y>x-54.
::4. y3x+85.
::5. 3x-2-2y46.
::6. x+4y}16Determine the equation of each linear inequality below.
::确定以下每一线性不平等的方程式。7.
8.
9.
10.
Explore More
::探索更多1. Xpress Taxi Service charges $1.50 per minute traveled minus $0.25 per minute spent in stopped traffic. You only have $10 in your wallet, so that is the maximum amount you can spend on your ride. Graph the inequality for this situation.
::1. Xpress出租车服务公司每分钟收费1.50美元,从每分钟0.25美元到每分钟0.25美元,在交通堵塞中花费,钱包里只有10美元,这是您在交通上可以花费的最大数额。2. Julian has a job as an appliance salesman. He earns a commission of $60 for each washing machine he sells and $130 for each refrigerator he sells. List three combinations of washers and refrigerators Julian can sell to make $1,000 or more in commission. (Hint: A graph may be helpful.)
::2. 朱利安从事电器销售工作,他每卖一台洗衣机挣60美元,每卖一台冰箱赚130美元,列出三套洗衣机和冰箱的组合,朱利安可以出售,以赚取1 000美元或以上佣金。 (提示:图表也许有用。 )3. A pound of coffee blend is made by mixing two types of coffee beans. One type costs $9.00 per pound and another type costs $7.00 per pound. Graph an inequality representing all the possible mixtures of weights of the two different coffee beans for which the blend costs $8.50 per pound or less.
::3. 混合两种咖啡豆可制造一磅的咖啡混合物,一种每磅9.00美元,另一种每磅7.00美元,一种不平等性代表两种不同咖啡豆的所有可能混合体,混合体每磅8.50美元或以下。4. An ounce of gold costs $670 and an ounce of silver costs $13. Graph an inequality representing all possible weights of silver and gold that make an alloy (combination of metals) that costs less than $600 per ounce.
::4. 一盎司黄金成本为670美元,一盎司银价为13美元。 分析一种不平等,它代表银和金的所有可能重量,使合金(金属组合)的成本低于每盎司600美元。5. A phone company charges 50 cents per minute during the daytime and 10 cents per minute at night. List three combinations of daytime minutes and nighttime minutes you would have to use to pay more than $20.00 over a 24-hour period.
::5. 电话公司在白天每分钟收费50美分,在晚上每分钟收费10美分,列出日间分钟和夜间分钟的三种组合,24小时支付超过20美元。6. A movie theater makes a profit of $10 on adult tickets and $4 for children's tickets. Write an inequality that expresses when the profit is less than $5,000. Graph the inequality.
::6. 电影院在成人票上赚取10美元的利润,在儿童票上赚取4美元的利润,在利润低于5 000美元时写出一种不平等,说明不平等情况。Answers for Review and Explore More Problems
::回顾和探讨更多问题的答复Please see the Appendix.
::请参看附录。PLIX
::PLIXTry this interactive that reinforces the concepts explored in this section:
::尝试这一互动,强化本节所探讨的概念:References
::参考参考资料1. “Human Body Weight,” last updated June 11, 2017, .
::1. “人体体重”,最近一次更新是2017年6月11日。 -
To graph linear inequalities, graph the boundary line. If the inequality is > or <, then the line will be dashed. If the inequality is
or
, then the line is solid.