5.3 垂直线测试
章节大纲
-
The graph below shows the gross domestic product (GDP), or the monetary value of all goods produced and services in the United States, during the period from 1910 to 1960. The period of the Great Depression is highlighted in pink 1 . Is this the graph of a function ? In this section, we will learn a test to determine whether or not it is.
::下图显示了1910年至1960年期间美国生产的所有商品和服务的国内生产总值(GDP)或货币价值,大萧条时期用粉色1 突出显示,这是函数的图表吗?在本节中,我们将学习一个测试,以确定它是否有效。
Vertical Line Test
::垂直线测试As we learned in the previous section, a function is a relation where each input, usually an x -value, corresponds to a unique output, usually a y -value. Graphically, this means that if we choose an x -value on the graph, there should be at most one point with that x -value since it corresponds to at most one y -value. We can use this idea to create a test for graphs to determine if they are the graphs of functions.
::正如我们在前一节中学到的,函数是指每个输入(通常是 x 值)与一个独有输出(通常是 Y 值)相对应的关系。从图形上看,这意味着如果我们在图形中选择一个 x 值,那么该X 值最多应该有一个点,因为它最多对应一个 y 值。我们可以使用这个想法为图形建立一个测试,以确定它们是否是函数的图形。The Vertical Line Test
::垂直线测试A graph of a relation is the graph of a function if every vertical line drawn through the graph intersects the graph at most once.Let's see how this test works.
::让我们来看看这个测试是如何运作的。Example 1
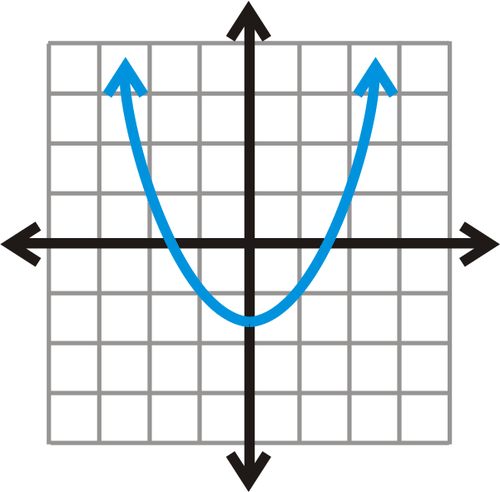
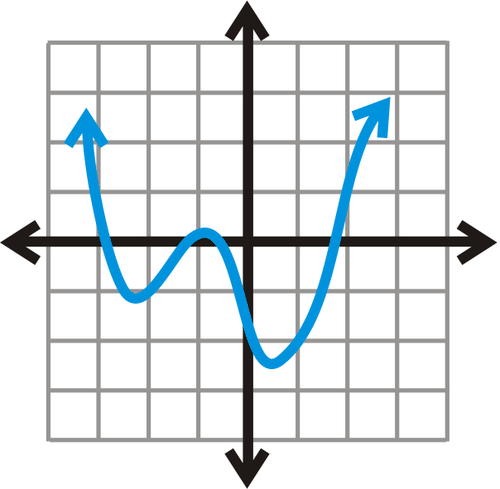
::例1Determine whether the graph of the relation is the graph of a function.
::确定关系图是否为函数图。
Solution:
::解决方案 :If we draw several vertical lines through this graph, we see that they intersect the graph only once. Therefore , this is a function.
::如果我们通过此图绘制几个垂直线, 我们可以看到它们只交叉过一次图形。 因此, 这是一个函数 。
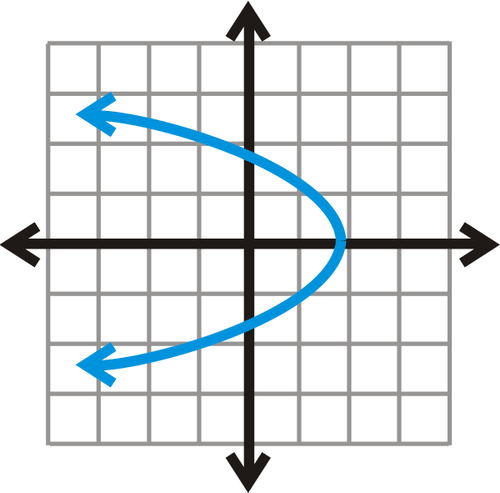
Example 2
::例2Determine if the graph of the circle, , represents a function.
::确定圆的图形 x2+y2=9 是否代表函数 。Solution: The graph of is a circle centered at the origin with a radius 3.
::解析度: x2+y2=9 的图形是一个圆形,以圆形3为圆形,以圆形3为圆形,以圆形3为圆形。Drawing some vertical lines through the circle, we see that the circle and the lines intersect twice.
::在圆圈中绘制一些垂直线,我们看到圆和线交错了两次。Even though a vertical line through (3,0) or (-3,0) would intersect the circle only once, the Vertical Line Test has to work for every vertical line drawn through the graph. This graph fails the Vertical Line Test, so a circle is not a function.
::即使垂直线贯穿于(3,0)或(3,0)的垂直线将圆圈仅相交一次,垂直线测试也必须为通过图形绘制的每条垂直线工作。此图无法进行垂直线测试,因此圆不是一个函数。by CK-12 demonstrates how to use a graph to determine if a relation is a function.
::CK-12 显示如何使用图表来确定关系是否为函数。Example 3
::例3Is the inequality a function?
::不平等 Y x - 1 是一个函数吗 ?Solution: First, we graph the inequality .
::解决方案:首先,我们绘制不平等的图表。
If we draw vertical lines through this graph, we see that they intersect with an infinite number of points on each line. Therefore, this inequality is not a function.
::如果我们在这个图中绘制垂直线条,我们看到它们与每一线条上无限多的点相交叉。 因此,这种不平等不是一个函数。
Example 4
::例4Does the green curve from the graph in the introduction represent a function?
::导 言中图表的绿色曲线是否代表函数 ?Solution: If we draw vertical lines through the graph, they intersect the graph at most one time. This graph is the graph of a function.
::解析度 : 如果我们在图形中绘制垂直线, 它们最多一次将图形相交。 此图是函数的图形 。
by Mathispower4u demonstrates how to use the Vertical Line Test to determine if a relation is a function.
::由 Mathispower4u 演示如何使用垂直线测试来确定关联是否是一个函数。Summary
::摘要-
Draw vertical lines through the graph. If any line intersects the graph in more than one point, then the graph is not the graph of a function.
::在图形中绘制垂直线条。如果任何线条在不止一个点中交叉图形,则图形不是函数的图形。
Review
::回顾Determine whether the graphs of the relations below are graphs of functions.
::确定以下关系图是否为函数图。1.
2.
3.
4.
5.
6.
7.
8.
9.
HINT: Recall that with open circles, the point is not included.
::HINT:回顾,在开放的圆圈中,这一点没有包括在内。10.

Explore More
::探索更多1. The graphs below show the actual number of tornadoes per month (black graph) as well as various percentile ranks in the number of tornadoes per month (red, yellow, green, blue, and pink graphs). 2 Which of the graphs are functions?
::1. 下图显示每月龙卷风的实际数目(黑图)以及每月龙卷风数目(红色、黄色、绿色、蓝色和粉红色图)中各种百分位数(红色、黄色、绿色、蓝色和粉红色图)。 2 哪些图表是函数?
2. The graph below shows the total revenue and spending as a percent of the GDP. 3 Do the graphs below look like functions?
::2. 下图显示总收入和开支占国内生产总值的百分比。 3 下面的图象象函数吗?
3. Below is a graph of the Folium of Descartes. 4 Is this the graph of a function?
::3. 下面是笛卡尔的图。 4 这是函数的图吗?
Answers for Review and Explore More Problems
::回顾和探讨更多问题的答复Please see the Appendix.
::请参看附录。PLIX
::PLIXTry these interactives that reinforce the concepts explored in this section:
::尝试这些强化本节所探讨概念的交互作用 :R eference s
::参考参考资料1. "Great Depression," last edited May 22, 2017, https://en.wikipedia.org/wiki/Great_Depression.
::1. “大萧条”, 2017年5月22日最后一次编辑, https://en.wikipedia.org/wiki/Great_Depression。2. "Inflation Adjusted Tornado Running Totals--Storm Prediction Center WCM Page," last modified February 26, 2009, http://www.spc.noaa.gov/wcm/adj.html.
::2. 2009年2月26日最后一次修改的“通货膨胀调整后的龙卷风运行总量-标准预测中心WCM页面”,http://www.spc.noaa.gov/wcm/adj.html。3. "An Update to the Budget and Economic Outlook: 2016 to 2026|Congressional Budget Office," last updated November 1, 2016, https://www.cbo.gov/publication/51908.
::3. “《预算和经济展望:2016年至2026年》最新资料”,最近一次更新是《国会预算办公室》,2016年11月1日,https://www.cbo.gov/publication/51908。4. "Folium of Descartes," last edited March 16, 2017, https://en.wikipedia.org/wiki/Folium_of_Descartes.
::2017年3月16日编辑, https://en.wikipedia. org/wiki/Folium_of_Descartes。 -
Draw vertical lines through the graph. If any line intersects the graph in more than one point, then the graph is not the graph of a function.