11.4 重大职能
章节大纲
-
Many large cities have to deal with a substantial rat population, and have taken steps to reduce the number of rats. The growth of a rat population can be quite rapid. One rat can produce 11 new rats every 11 weeks 1 . If this growth goes unabated, how many rats are in the population after six months?
::许多大城市必须对付大量的老鼠,并采取措施减少老鼠数量。老鼠人口的增长可能非常快。一只老鼠每11周可以生产11只新的老鼠。 如果这种增长没有减少,6个月后有多少老鼠在人口中?Growth of this type is called exponential, and we discuss functions of this type in this section.
::这种类型的增长被称为指数增长,我们在本节讨论这种类型的功能。
Identifying Exponential Growth or Decay
::识别指数增长或衰减When we discussed linear models, we observed that as the -values increased by 1 unit, the -values would go up or down by the same amount. For example,
::当我们讨论线性模型时,我们观察到,随着x值增加1个单位,y值会上升或下降相同数额。例如,0 5 8 1 9 6 2 13 4 3 17 2 As the -values go up by 1, the -values go up by adding 4, or the -values go down by subtracting 2. This is linear growth or decay.
::随着x值上升1, y1值上升4, y2值上升2, 这是线性增长或衰变。or decay occurs when there is a constant factor by which you can multiply or divide the outputs to get the next output. For example,
::或衰变发生时,会有一个常数系数,使输出乘以或除以以获得下一个输出。例如,0 4 4 1 8 2 2 16 1 3 32 Notice how the -values increase by multiplying by 2 in the case of , or by dividing by 2 in the case of . If the factor we are multiplying or dividing by is constant, then we can write a model for our exponential data. First, let's try an example to identify exponential data.
::注意 Y 值在 y1 中是如何乘以 2 增加的,在 y2 中是如何乘以 2 增加的。 在 y2 中则除以 2 增加的。 如果我们正在乘以或除以的系数是不变的, 那么我们可以为我们的指数数据写一个模型。 首先, 让我们尝试一个示例来识别指数数据 。Example 1
::例1Identify whether the following tables could contain data that is exponential.
::确定下表是否包含指数数据。a.
::a 。-1 3 0 4 1 5 2 6 b.
::b. b. 数据-2 1 0 9 2 81 4 729 c.
::c. 用于以下目的:-2 3 -1 5 0 8 1 12 Solution:
::解决方案 :a. To determine if data is exponential, we have to see if the ratios of equally spaced outputs are constant. Here, so this data cannot be modeled exponentially. It can be modeled linearly however. As the -values go up by 1, the -values go up by 1.
::a. 要确定数据是否指数值,我们就必须看相同间距输出的比重是否不变。 这里, 435465, 这样数据不能以指数值建模。 但是, 它可以用线性模型建模。 随着x值上升1, Y值上升1。b. Again, we test the ratios to see if this is exponential data: . This data can be modeled exponentially.
::b. 我们再次测试比率,看这是不是指数数据:91=819=72981=9。c. The ratios for this data are not equal: , so this is not exponential data.
::c. 这一数据的比率不相等:5385128,所以这不是指数数据。Exponential Functions
::指数函数An exponential function has the variable in the exponent of the expression .
::指数函数在表达式的引号中含有变量。Exponential Functions
::指数函数An exponential function is a function of the form where and is a real number .Note: In applications, we can think of as the growth or decay factor , and as the initial value.
::注:在应用中,我们可以将b视为生长或衰变系数,将b视为初始值。Example 2
::例2Write the exponential function that describes the data in Example 1b.
::写入用于描述例1b中数据的指数函数。Solution: We can find the exponential function using the data points because the ratios of the data points remain constant. Since we have a point at , let's substitute the values from that point to see if we can find either or .
::解答: 我们可以使用数据点来找到指数函数, 因为数据点的比重保持不变 。 既然我们在 x=0 上有一个点, 让我们从该点来替代值, 看看能否找到一个或 b 。Now that we know , let's use another point to find .
:0,9,9y=abx9=ab09=a(1)9=a) 现在我们知道a,让我们用另一个点来找到b。
The function that models this data is
:Example 3
::例3One rat can produce 11 new rats every 11 weeks 1 . If this exponential growth goes unabated, how many rats are in the population after 6 months?
::一只大鼠每11周可生产11只新老鼠。 如果这一指数增长没有减少,6个月后有多少大鼠在人口中?Solution: Again, we have two data points, so we can find the exponential function that models this situation. There is 1 rat at time 0, and there are 12 rats (11+1) after 11 weeks.
::解答: 再说一遍, 我们有两个数据点, 这样我们就能找到模拟这种情况的指数函数。 时间0时有1只老鼠, 11周后有12只老鼠( 11+1) 。Now that we know , we can use the other point to find .
:
:The function that models this data is . With our function, we can determine the number of rats in the population after 6 months or 26 weeks.
::以 Y= (1. 25x) 模式此数据为模型的函数。 有了我们的函数, 我们就可以在 6 个月或 26 周后确定鼠群中老鼠的数量 。
::y=( 1. 25) 26 @% 331Therefore , the rat population caused by 1 rat after six months is 331 .
::因此,6个月后,由1只老鼠引起的鼠群为331个。by Michael W shows how to find the exponential function given two points.
::Michael W 显示如何从两个点中找到指数函数 。Graphing Exponential Functions
::图形指数函数Let's start with an example that has an initial value of 1.
::让我们先举一个最初值为 1 的例子。Example 4
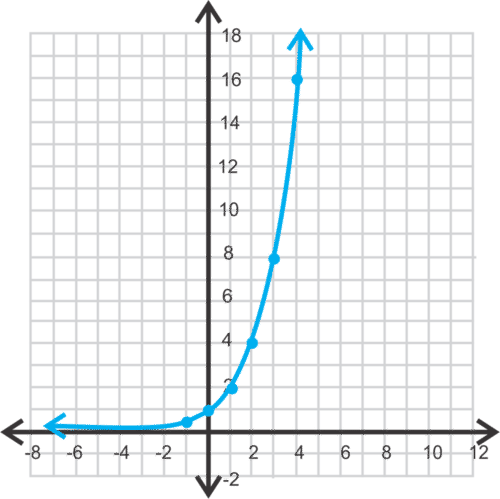
::例4Graph .
::图y=2x。Solution: We make a table of values, including some positive and negative values for and 0.
::解决办法:我们编制一个数值表,包括x和0的一些正值和负值。3 8 2 4 1 2 0 1 -1 -2 -3 Next we plot the points from this table on a set of coordinate axes and connect them with a curve. The graph of is below.
::接下来,我们从这张表格中绘制一组坐标轴上的点,然后将其与曲线连接起来。下面是 y=2x 的图形。From the table, we see that the - intercept is (0, 1). We can raise 2 to any power so the domain is all real numbers.
::从表格中,我们可以看到 Y 界面是 (0, 1) 。 我们可以将 2 调高到任何能量, 这样这个域就是真实的数字 。For the range , notice that the function gets very close to the -axis, but never touches or passes through it. Even if we choose would be , which is still not 0, but quite close. In fact, the function will never reach 0, even though the outputs will get smaller and smaller. Therefore, this function approaches the line , but will never touch or pass through it. This type of boundary line is called an asymptote . The range is then .
::对于范围,请注意该函数非常接近 x 轴, 但从不触摸或通过它。 即使我们选择 x=- 50, y 也为 2- 50= 12550, 仍然不是 0, 但相当接近。 事实上, 该函数永远不会达到 0, 即使输出会越来越小。 因此, 此函数接近 y=0 线, 但永远不会触碰或通过它。 此类型的边界线被称为“ 无线” 。 范围是 (0,\\\\) 。This shape is the typical shape of an exponential growth function . For an exponential function to be a growth function, and . The graphs of and are below. Notice a s increases, the graph gets steeper to the right of the -axis, but flatter to the left.
::此形状是指数增长函数的典型形状。 要使指数函数成为增长函数, a>0 和 b>1 。 y=3x 和 y=6x 的图形在下面。 注意作为 b 增加, 图形向 y 轴 右移动, 但向左缩放 。
Example 5
::例5Graph and compare it to .
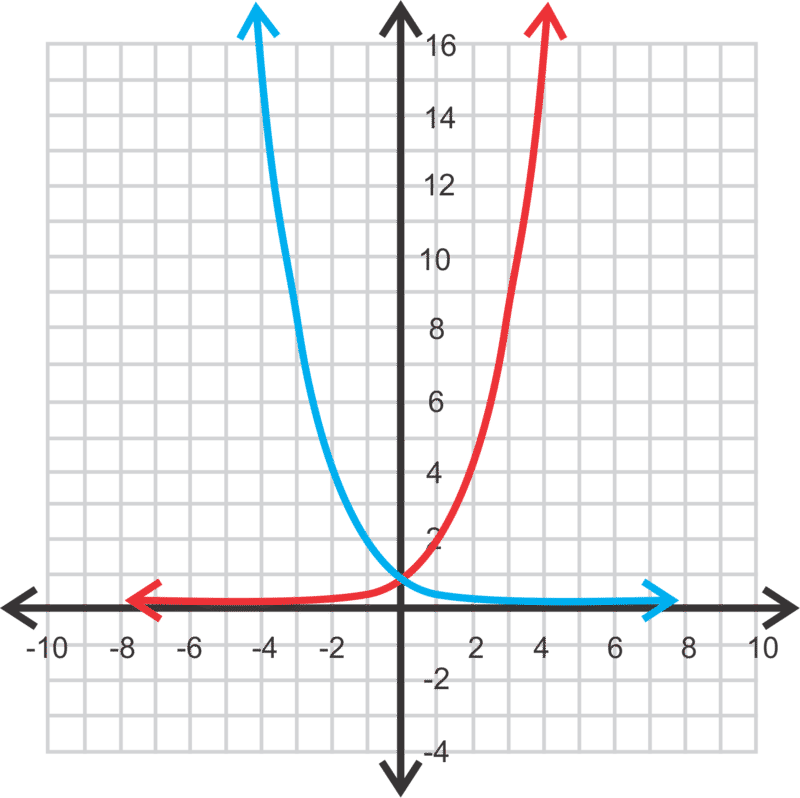
::图y=( 12) x 并将其与 y= 2x 比较。Solution: Let's make a table of values for both functions and then graph.
::解决方案:让我们为两个函数和图形绘制一个数值表。3 2 1 0 -1 -2 -3 The graphs of these functions are below. is blue and is red.
::这些函数的图形在下面。 y=( 12) x 是蓝色, y=2x 是红色。Notice that instead of exponential growth, the function decreases from left to right, so it is an exponential decay function . To be a decay function, . Also notice that is a reflection over the -axis of since .
::请注意, y= (12x) 函数不是指数增长, 而是从左向右下降, 所以它是一个指数衰变函数。 要成为衰变函数, 0<b < 1. 还要注意, y= (12x) 是y 轴y= 2x的反射, 因为 y= (12x) = (2-1) x= 2x 。The exponential decay function shares many of the same properties of the exponential growth function. The domain, range, -intercept, and asymptote of are all the same. However, a s decreases , the graph gets steeper and flatter. Compare the graphs of and below.
::指数衰减函数共享指数增长函数的许多相同属性。 y=0的域、 范围、 y- intercept 和 y=0 的微数都是相同的。 但是, 由于 b 下降, 图形会更陡峭、 更受欢迎。 比较下面 y= (13x) 和 y= (16x) 的图形 。
There are some properties shared by all exponential functions of the form .
::窗体 y=abx,a>0 中的所有指数函数都具有一些共享属性。Properties of ,
::y=abx 属性的 y=abx 属性-
The domain is all real numbers or
.
::域名是所有实际数字或 (- , ) 。 -
The range is
or
.
::范围是 y>0 或 (0,\\\\\) 。 -
There is a
horizontal asymptote
of
.
::y=0 的横向末数 。 -
The
-intercept is (0,1). There are no
-
intercepts
.
::Y 界面是 (0, 1) 。 没有 x 界面 。 -
The function is an exponential growth function if
.
::b>0 函数为指数增长函数。 -
It is an exponential decay function if
.
::0<b<1) 是一个指数衰变函数。
by Mathispower4u discusses how to graph exponential functions.
::Mathispower4u 讨论如何绘制指数函数。Example 6
::例6Determine which of the functions below are functions or exponential growth functions. Briefly explain your answer.
::确定以下哪些函数是函数或指数增长函数。简单解释您的答复。a.
::a.y=4(1.3)xb.
::b. f(x)=3(65)xc.
::c.y=(310)xSolution: a and b are exponential growth functions because . c is an exponential decay function because is between 0 and 1.
::溶液: a 和 b 是指数增长函数, 因为 b>1. c 是指数衰变函数, 因为 b 在 0 和 1 之间 。Transformations of Exponential Functions
::指数函数的转变All exponential functions have the form , where and are real numbers . indicates a dilation and possibly a reflection across the x-axis , and indicate shifts of the function horizontally and vertically , respectively.Example 7
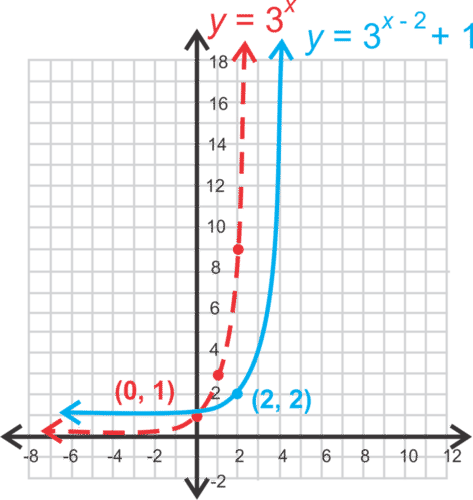
::例7Graph . Find the -intercept, asymptote, domain, and range.
::图 y= 3x-2+1. 查找 y 界面、 零点、 域和范围 。Solution: We can graph this by graphing and then shifting it or 2 units along the - axis and or 1 unit along the - axis .
::解析度: 我们可以通过图形 y= 3x 绘制这个图, 然后沿着 x 轴和 k 或 1 单位沿 y 轴 移动 h 或 2 个单位 。Notice that the point (0, 1) from gets shifted to the right 2 units and up one unit and is (2, 2) in the translated function, . To find the -intercept, plug in .
::请注意 y= 3x 的点 (0, 1) 被移到右 2 个单位和上方一个单位, 在翻译函数 y= 3x-2+1 中是 2, 2 。 要找到 y 接口, 插入 x= 0 。
::y=30-2+1=3-2+1=119=1.1T he asymptote moves up 1 unit as well and is . Therefore, t he range is . The domain of all exponential functions is all real numbers.
::单点向上移动 1 个单位, y= 1 。 因此, 范围是 y> 1 。 所有指数函数的域都是真实数字 。We can also graph this function by creating a table of values, plotting the points, and connecting them with a curve.
::我们还可以通过创建数值表、绘制点和将其与曲线连接来绘制此函数的图形。Example 8
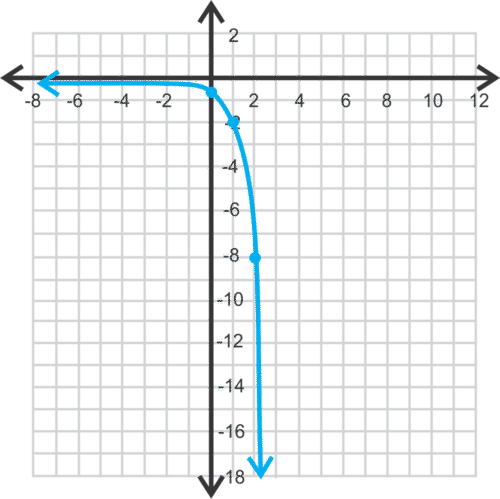
::例8Graph the function Identify the -intercept, asymptote, domain, and range.
::函数 g( x) = 4x 的图形。 识别 y 界面、 空点、 域和范围 。Solution: Let's make a table of values for this example.
::解决方案:让我们为这个例子绘制一个数值表。-1 0 1 2 Next, we plot the points and draw the graph. It is helpful to think of the transformations to the function . All of the outputs are divided by 2 and the graph is reflected over the -axis.
::接下来,我们绘制点并绘制图表。如果想出函数 y= 124x 的转换,将很有帮助。所有输出除以 2,而图则在 X 轴上方显示。The domain is all real numbers and the range is The asymptote is and the -intercept is the point from our table .
::域名是所有真实数字,范围是 y < 0。 空数是 y=0, y- interview 是我们表格( 0, 12) 的点 。Example 9
::例9Graph . Find the -intercept, asymptote, domain, and range.
::图g(x) =- 2( 23) x-1+1. 查找 y- intercept、 空点、 域和范围 。Solution: We can graph in red below, and shift it to the right 1 unit and up 1 unit. The final graph is the blue function below.
::解析度: 我们可以用下面的红色来图y=-2(23x), 然后将其移到右边的 1 个单位和上方 1 个单位。 最后的图形是下面的蓝色函数 。The -intercept is
::y 界面是
::y=-2(230)-1+1=-232+1=-3+1=-2。The horizontal asymptote is , the domain is all real numbers and the range is .
::水平数为y=1, 域为所有真实数字, 范围为 y < 1 。How to Graph Exponential Functions With Desmos
::如何用 Desmos 图形显示指数函数Use the caret key ^ (Shift 6) to get to the exponent part. Use " data-term="Parentheses" role="term" tabindex="0"> parentheses for (x+1) in the exponent.
::使用 (Shift 6) 来获取引号部分。在引号中使用括号 (x+1) 。
by CK-12 discusses how to graph exponential functions in Desmos.
::by CK-12 讨论如何在 Desmos 中绘制指数函数 。How to Graph Exponential Functions With a TI-83/84
::如何用 TI-83/84 绘制指数函数图Use the carot key ^ (Shift 6) to get to the exponent part. Use parentheses for (x+1) in the exponent.
::使用 (Shift 6) 来获取引号部分。 在引号中使用括号 (x+1) 。
Feature: The Pregnancy "Glow"
::特色:怀孕“Glow”by Meredith Beaton
::梅雷迪思·贝顿(签名)You may have heard that women "glow" during pregnancy, and while most women are not literally emitting a glowing light, many do appear different. That difference is often due to the rapid changes in hormones that occur as a fertilized egg implants in the uterus and the fetus and placenta start to develop.
::你可能听说过妇女在怀孕期间“发光 ” , 虽然大多数妇女并没有真正发出发光的灯光,但许多妇女似乎确实不同。 这一差异往往是由于子宫和胎儿及胎盘的受精卵植入开始发育,导致荷尔蒙迅速变化所致。Amazing But True
::令人惊异但真实When a woman becomes pregnant, her hormones change even more dramatically than they did during puberty. Human Chorionic Gonadotropin (hCG) is one of the most important hormones that is released during pregnancy. In fact, this is the hormone that is detected for a pregnancy test. When an egg is fertilized, the protective layer surrounding the embryo releases hCG and tells the body to maintain a thick lining in the uterus, where the embryo will implant and grow into a fetus. If hCG were not released, then the body would have no way of knowing it was pregnant and the woman would shed the lining of her uterus with her regular menstrual cycle.
::当妇女怀孕时,她的荷尔蒙会比在青春期发生更剧烈的变化。人类Chorionic Gonadotropin(HCG)是孕期释放的最重要的荷尔蒙之一。事实上,这是孕期测试所检测到的荷尔蒙。当卵受精时,胚胎周围的保护层会释放HCG,并告诉身体在子宫内保持厚的内衬,胚胎会植入并成长为胎儿。如果HCG没有被释放,那么身体将无法知道它是否怀孕,而该妇女会用正常的月经循环将子宫的内膜脱去。
Because hCG is so critical for maintaining the pregnancy, the level of hCG hormone doubles in a woman's body every two days after conception until it plateaus around 40 weeks at about 100,000 milli-Units/mL. Based on this exponential growth of hCG levels, healthcare providers can monitor hCG levels to determine if a pregnancy is viable (hCG is high enough) or if there is an abnormality with the pregnancy (slightly higher levels may indicate a multiple pregnancy; extremely high levels may indicate a problem with the pregnancy). For instance, if levels of hCG start to go down or do not increase to the expected level, the healthcare provider may order additional tests to determine the health of the fetus.
::由于HCG对保持妊娠至关重要,孕后,女性体内的HCG荷尔蒙水平每受孕后两天就会翻一番,直到怀孕40周左右达到约100 000毫升/毫升。 根据HCG水平的指数增长,保健提供者可以监测HCG水平,以确定怀孕是否可行(HCG足够高),或者是否怀孕异常(稍高的等级可能表明怀孕次数多;极高的等级可能表明怀孕有问题)。例如,如果HCG水平开始下降或没有提高到预期水平,保健提供者可以要求进行更多的检查,以确定胎儿的健康情况。by Janux discusses hormones during pregnancy.
::雅努讨论孕期荷尔蒙。Summary
::摘要-
Data in a table of values is exponential if there is a factor by which you can multiply or divide to get the next outputs.
::数值表中的数据是指数化的,如果有一个系数可以乘或除以获得下一个输出。 -
An exponential function is a function of the form
where
and
is a real number.
::指数函数为y=abx形式的函数,其中 b>0,b1和a0是一个实际数字。 -
If
, the graph will increase from left to right and the function is an exponential growth function. If
, the graph will decrease from left to right and the function is an exponential decay function.
::如果 b>1, 图形将从左向右增长, 函数是一个指数增长函数。 如果 0 <b < 1, 图形将从左向右下降, 函数是一个指数衰减函数 。 -
To find an exponential function given points, substitute the known values into
and solve the system of equations.
::要找到指数函数给定点, 请将已知值替换为 y=abx 并解析方程系统 。 -
To graph an exponential function, make a table of values.
::要绘制指数函数图,请绘制一个数值表。
Review
::回顾Determine if the tables below can be modeled with an exponential model. If so, find the exponential function using two points from the table.
::确定是否可以用指数模型模拟以下表格。如果可以,则使用表格中的两个点来查找指数函数。1.
a.
::a 。0 5 1 7 2 9 3 11 b.
::b. b. 数据0 1 2 3 c.
::c. 用于以下目的:0 -6 1 -8 2 -12 3 -18 d.
::d. 数据0 -1 1 -2 2 -4 3 -8 Determine which of the following functions are exponential growth or exponential decay:
::确定下列哪些函数是指数增长或指数衰减:2 . a. b. c .
::2. a.y=(43xb.y=5xc.y=(14)xd . f. e .
::d.y=1.6xf.e.y=0.99xGraph the exponential functions below. Find the -intercept, the equation of the horizontal asymptote, the domain, and the range for each function.
::图形显示下面的指数函数。 查找 Y 界面、 水平单点的方程式、 域以及每个函数的范围 。3.
::3. y=4x4.
::4. y=( 12) x5.
::5.y=(-1)(5)x6.
::6. y=3x-27.
::7.y=2x+18.
::8.y=6x+3 y=6x+39.
::9.y=(0.8)x+210.
::10.y=14(2)x+311.
::11.y=7x+3-512.
::12.y=(0.75x-2+4)13.
::13.y=-(3)x-4+2Explore More
::探索更多1. March Madness is a single-game elimination tournament of 64 college basketball teams 2 .
::1. March Manness是64个大学篮球队的单场消除赛。 2a. How many games will be played until there is a champion? Include the championship game.
::a. 在获得冠军之前将玩多少场比赛?包括冠军赛。b. In 2012, the tournament added 4 teams to make it a field of 68, and there are 4 "play-in" games at the beginning of the tournament. How many games are played now?
::b. 2012年,锦标赛增加了4个球队,使比赛成为68场球场,比赛开始时有4场“玩耍”比赛。2. An investment grows according the function where represents the initial investment, represents the value of the investment, and represents the number of years of investment.
::2. 根据功能A=P(1.05),投资增长,P代表初始投资,A代表投资价值, t代表投资年数。a. If $10,000 was the initial investment, how much would the value of the investment be after 10 years, to the nearest dollar?
::a. 如果最初投资为10 000美元,投资价值在10年后到最接近的美元将达到多少?b. How much would the value of the investment be after 20 years, to the nearest dollar?
::b. 投资价值在20年后到最接近的美元将有多少?3. The population of a city was 10,000 in 2012 and is declining at a rate of 5% each year. If this decay rate continues, what will the city's population be in 2017?
::3. 2012年,城市人口为10,000人,每年以5%的速度下降,如果这一衰变率继续下去,2017年城市人口会是多少?4. A discount retailer advertises that items will be marked down at a rate of 10% per week until sold. The initial price of one item is $50.
::4. 一家贴现零售商广告说,在售出之前,每星期将标出10%的物品,一份物品的最初价格为50美元。a. Write an exponential decay function to model the price of the item weeks after it is 1st put on the rack.
::a. 写一个指数衰变函数,以模拟物品在架架上第1张之后的 x 周价格。b. What will the price be after the item has been on display for 5 weeks?
::b. 5周内显示物品后的价格如何?c. After how many weeks will the item be half its original price?
::c. 在项目价值为原价一半的几个星期后,该项目将达到多少周?5. An old fable used to demonstrate exponential growth goes as follows: A king and one of his subjects were playing chess, and the king said if the subject could beat him at the game, he would give him anything he wanted. The subject, like many in the land, was hungry, and asked the king for an unusual prize. The subject asked for a grain of rice for the 1st square on the chess board, and then for double the amount for each square on the board thereafter. The king was shocked that the subject wanted so little for winning, and agreed to the prize immediately. They proceeded to play and the subject won. The king began to fill the squares with grains of rice and soon realized that the prize was not little at all.
::5. 用来显示指数增长的古老传说如下:国王及其臣民之一在玩棋,国王说,如果一个臣民能在比赛中打败他,他愿意给他任何他想要的东西;象许多国王一样,他挨饿,要求国王给予不寻常的奖赏;象棋板上第1广场要一粒米,然后是董事会上每个广场的两倍;国王震惊地认为,臣民对胜利的渴望如此之小,国王立即同意了奖项;他们开始玩耍,主题获胜;国王开始用稻谷填满广场,很快意识到奖项并不少。There are 64 squares on a chess board. Find the total number of grains of rice that the subject received.
::象棋棋盘上有64平方块。 查找对象收到的稻米谷物总数 。
6. The domain of the exponential function is all real numbers, which includes irrational numbers. To approximate the value of an irrational exponent, we can find the values of rational exponents with more and more digits of the irrational number. A pproximate by filling in the following table. What is its approximate value?
::6. 指数函数的域是所有真实数字,其中包括非理性数字,为了接近非理性指数的值,我们可以在不合理数字的数位中找到理性指数的值。7 . Below is a table representing the annual savings on the electricity bill for a homeowner in Los Angeles with a 5.5-kilowatt photovoltaic solar panel system. This system offsets 95% of the homeowner's electricity use. With electricity rates increasing a certain percentage every year, the homeowner's savings increased as well.
::7. 下表显示洛杉矶拥有5.5千千伏光伏太阳能电池板的房主每年的电费节省情况,这一系统抵消了房主95%的用电量,随着电费逐年增长,房主的储蓄也有所增加。Year Annual Savings 2010 $1,175.35 2011 $1,245.87 2012 $1,320.62 2013 $1,399.86 2014 $1,483.85 2015 $1,572.88 2016 $1,667.26 2017 $1,767.29 2018 $1,873.33 2019 $1,985.73 2020 $2,104.87 2021 $2,231.17 Do you think this data represents a linear or an exponentia l relationship ? Why? Plot this table in your graphing utility and create a scatter plot. What observations can you make about the data points?
::您认为此数据代表线性或指数性关系吗 ? 为什么? 在您的图形工具中绘制此表格, 并创建一个散射图。 您可以对数据点做什么观察 ?by Desmos shows how to use Desmos for exponential regression equations of the type:
::在 Desmos 中显示如何使用 Desmos 来计算 y=abx 类型的指数回归方程式。by MySecretMathTutor shows how to do regressions with a TI-83/84.
::My SecreetMathTutor 展示了如何使用 TI-83/84 进行回归。Answers for Review and Explore More Problems
::回顾和探讨更多问题的答复Please see the Appendix.
::请参看附录。PLIX
::PLIXTry this interactive that reinforces the concepts explored in this section:
::尝试这一互动,强化本节所探讨的概念:References
::参考参考资料1. "Rat Population Growth Model, Chicago Magazine, March 2015,"
::1. 2015年3月芝加哥杂志《拉特人口增长模型》2. "2017 Division 1 Men’s Basketball Tournament,"
::2. "2017年一师男子篮球锦标赛" -
The domain is all real numbers or
.