1.13 线性等式
章节大纲
-
Introduction
::导言Suppose there is a linear relationship between your annual income and the amount you must pay in state income tax. Could you create a graph that shows how much tax you must pay based on your income?Linear Equations
::线性等式You probably recall how to solve equations in one variable . The answers are in the form variable = some number . In this section, you will learn how to solve equations with two variables. Below are several examples of two-variable equations:
::您可能还记得如何在一个变量中解析方程式。 答案在窗体变量 = 某些数字中。 在本节中, 您将学习如何用两个变量解析方程式。 下面是两个变量的几个例子:%5C%5C%0A3m%26%2B4n%3D1%5C%5C%0Ay%26%20%3D4x%2B7">
::p=203m+4n=1y=4x+7
You may recognize these equations from another section, and you'll see how to graph them in this section. Their solutions are not one value because there are two variables. The solutions to these equations are pairs of numbers. These pairs of numbers can be graphed in a Cartesian plane .
::您可以从另一部分中识别这些方程式, 您可以看到如何在本部分中绘制这些方程式。 它们的解决方案不是一个值, 因为有两个变量。 这些方程式的解决方案是数字的对等方程式。 这些对等数字可以在笛卡尔平面中绘制图表 。The solutions to an equation in two variables are sets of ordered pairs.
::两个变数中的方程式解决方案是一对定购的配对。The solutions to a linear equation are the coordinates on the graphed line.
::线性方程式的解决方案是图形化线的坐标。Graphing Using a Table of Values
::使用数值表绘制图表You can make a table of values for the two variables that are the solutions to the linear equation.
::您可以为两个变量绘制一个数值表,这两个变量是线性方程的解决方案。See the examples below or watch the following video for a demonstration on how to graph a linear equation by making a table and then graphing points:
::见下文的例子,或观看以下录像,以示范如何通过绘制表格然后绘制图表点来绘制线性方程图:Graphing a Line Using Other Methods
::使用其他方法绘制一行In addition to creating a table, you can graph a linear equation by using intercepts or coordinates of points, or an intercept and the of the line.
::除创建表格外,还可以使用截取或点坐标,或截取和线条坐标,绘制线性方程图。To find the graph of a line using the intercepts, start by setting . This will give you the -intercept. Then set to find the -intercept.
::要找到使用拦截的线条图, 请从设置 y=0 开始。 这将给予您 x 拦截。 然后设定 x=0 以查找 y 拦截 。Examples
::实例Example 1
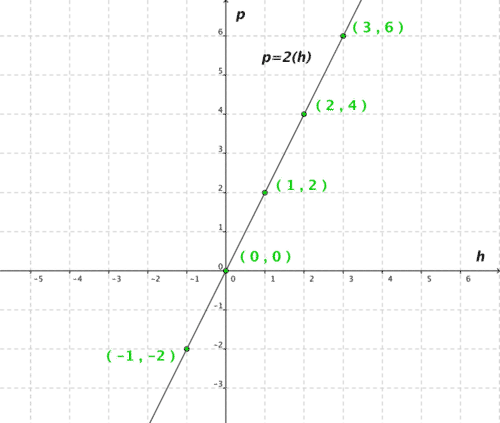
::例1Graph "> .
::图p=2Solution:
::解决方案 :Make a table and then graph the points:
::绘制表格,然后绘制点形图:0 0 1 2 2 4 3 6 Example 2
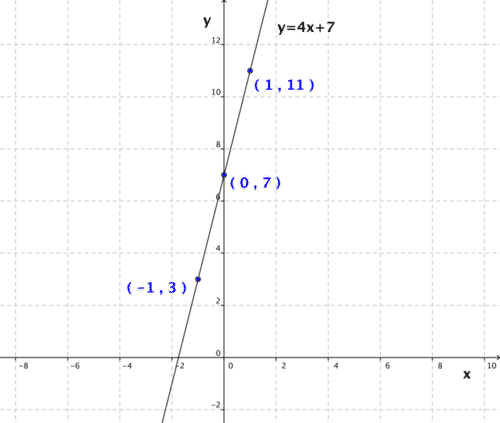
::例2Graph .
::图y=4x+7。Solution:
::解决方案 :Make a table and then graph the points.
::绘制一个表格,然后绘制各个点的图表。-1 3 0 7 1 13 Example 3
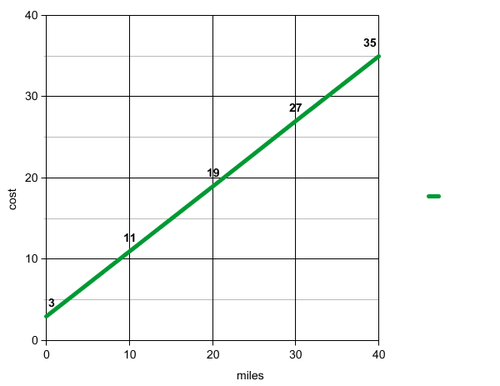
::例3A taxi fare costs more the further you travel. Taxis usually charge a fee on top of the per-mile charge. In this case, the taxi charges $3 as a set fee, and $0.80 per mile traveled. Find all the possible solutions to this equation.
::出租车费越多,您旅行的车费就越高。 出租车费通常在每英里收费之外收费。 在这种情况下,出租车费为3美元,每英里交通费为0.80美元。 找到这个方程的所有可能的解决方案。Solution:
::解决方案 :Here is the equation in slope-intercept form , linking the cost in dollars "> to hire a taxi and the distance traveled in miles
::这是斜坡界面的方程,将用美元计算的费用与租用出租车的费用和里程(x):y=0.8x+3)所走的距离联系起来。
This is an equation in two variables. By creating a table, we can graph these ordered pairs to find the solutions:
::这是两个变量中的方程式。 通过创建表格, 我们可以用图表来显示这些有顺序的对子, 以找到解决方案 :(miles) (cost $) 0 3 10 11 20 19 30 27 40 35 The solutions to the taxi problem are located on the green line graphed above. To find any cab ride cost, you need to find the of the desired .
::出租车问题的解决方案位于上面图表的绿线上。要找到任何出租车开销,您需要找到想要的 x 的 y 。Note: While the above examples found multiple points, which can be helpful to check your work, a line is defined by any two points on it. Once these are plotted, you can graph the whole line.
::注意: 上述示例发现了多个点, 有助于检查您的工作, 线条则用其中的任何两个点来定义。 一旦绘制了这些点, 您可以绘制整行图 。Example 4
::例4Graph .
::图2x+3y=12。Solution:
::解决方案 :Find the intercepts by setting each variable to zero and solving for the other:
::将每个变量设置为零, 并解决另一个变量, 以查找拦截 :
::2x+3( 0)=122( 0)+3y=122x=12 12 3y=12x=6y=4Plot the intercepts and draw a line to connect them:
::绘制截取的地图并绘制连接它们的线条:
To find the graph of a line using the -intercept, 1st solve for to get the equation in slope-intercept form, or , where is the slope and is the -intercept. Then plot the -intercept and use the slope to find the next point on the line.
::要用 y 界面找到线条的图形, y 的答案是 y , y 的答案是 y 斜度- 截取形式, y = mx+b, 其中 m 是 斜度, b 是 y 截取。 然后绘制 y 截取, 并使用 y 斜度来找到线上下一点 。Example 5
::例5Graph .
::图2x+3y=21。Solution:
::解决方案 :Start by rewriting this equation in slope-intercept form:
::开始重写此方程式, 以斜坡界面形式 :
::2x+3y=213y=2x+21y=23x+7This is now in slope-intercept form, so identify the slope and intercept: and .
::这现在以斜坡界面形式出现,因此标明斜坡和截取器:m=23和b=7。Finally, graph the intercept and use the slope to find the next point:
::最后,请绘制拦截图,然后用斜坡找到下一点:
Note that you could use any point on the graph (not just the intercept) along with the slope to plot a line.
::请注意,您可以使用图表上的任何点(而不仅仅是拦截)和斜坡绘制一条线。Review
::回顾-
What are the solutions to an equation in two variables? How is this different from an equation in one variable?
::两个变量中的方程式的解决方案是什么?这与一个变量中的方程式有什么不同? -
Think of a number, triple it, and then subtract 7 from your answer
. Make a table of values and plot the function that this sentence represents.
::想象一个数字, 乘以三倍, 然后从您的答复中减去 7 。 绘制一个数值表, 并绘制此句所代表的函数 。
Graph the solutions to each linear equation by making a table and graphing the coordinates.
::通过绘制表格和绘制坐标图,绘制每个线性方程的解决方案。-
::y=2x+7 y=2x+7 -
::y=0.7x-4 y=0.7x-4 -
::y=6 - 1.25x -
::y=43x-6 y=43x-6
Graph the solutions to each equation by using the intercepts.
::使用拦截来绘制每个方程式的解决方案 。-
::7+y7 -
::y+3=32(x+4) -
::y=x-6 y=x-6
Graph the solutions to each equation by using the -intercept or another point and the slope.
::使用 y 界面或另一个点和斜度绘制每个方程的解决方案。-
::y5x-2 -
::y-5=4(x+2) -
::y+8=16x y+8=16x
Graph the following using any method.
::使用任何方法绘制下图。-
::y+4=23(x-2) -
::y3x+7 y3x+7 -
::- 4x+5y=30
Review (Answers)
::回顾(答复)Please see the Appendix.
::请参看附录。 -
What are the solutions to an equation in two variables? How is this different from an equation in one variable?