3.2 二次函数
章节大纲
-
Introduction
::导言
Quadratic functions are a special group of polynomial functions. They will be used to establish the most important characteristics of . Consider the function that gives the height of a balloon launched from a roof 54 feet above the ground, H ( t ) = − 1 2 t 2 + 8 t + 54 , 0 ≤ t ≤ 21 , where t is the number of seconds after launch.
::二次曲线函数是一组特殊的多边函数。 它们将用于建立 . 最重要的特性 。 考虑从地面上54 英尺高的顶部发射的气球高度的函数, H( t) 12t2+8t+54, 0t21, 其中 t 是发射后的秒数 。The graph demonstrates that this function has one maximum value of 86 feet, at 8 seconds after launch. The path of the balloon is smooth, continuous , and predictable. In this chapter we will develop techniques so that when predicting behavior based on the quadratic function , we can establish that there is only one extreme value (which can be a minimum or maximum). For this example, the function increases up to t = 8 and then decreases, so this function has a maximum at t = 8 :
::该图显示,该函数的最大值为86英尺,在发射后8秒。气球的路径是平滑、连续和可预测的。在本章中,我们将开发各种技术,以便在根据二次函数预测行为时,我们可以确定只有一个极端值(可以是最小值或最大值)。例如,该函数最多增加到t=8,然后减少,因此该函数的最大值为t=8:
Quadratic Functions
::二次曲线函数Forms of Quadratic Functions
::二次函数的形式H ( t ) = − 12 t 2 + 8 t + 54 is an example of a quadratic function written in standard form .
::H(t)12t2+8t+54是标准格式书写二次函数的例子。-
Standard form:
f
(
x
)
=
a
x
2
+
b
x
+
c
,
where
a
,
b
, and
c
are real numbers and
a
≠
0
.
::标准窗体:f(x)=ax2+bx+c,其中a、b和c为实际数字和a+++0。 -
Vertex
form:
f
(
x
)
=
a
(
x
−
h
)
2
+
k
,
where
h
=
−
b
2
a
and
">
k
=
f
(
h
)
.
::vertex 窗体: f( x) =a( x- h) 2+k, hb2a 和 k=f( h) 。 -
Factored form
:
f
(
x
)
=
a
(
x
−
r
1
)
(
x
−
r
2
)
,
where
r
1
and
r
2
are the roots of the function
.
::系数表 : f(x) =a(x-r1)(x-r2),其中 r1 和 r2 是函数的根部 。
Characteristics of Quadratic Functions
::二次函数的特征When the quadratic function is written in vertex form, it is easy to see that it is related to the squaring family of functions. Clearly, f ( x ) = a ( x − h ) 2 + k expresses the following transformations applied to the parent function , f ( x ) = x 2 :
::当二次函数以顶点形式写成时,很容易看到它与函数的对角组合有关。很明显, f(x)=a(x-h)2+k表示对父函数应用的以下转换, f(x)=x2:-
Shift
horizontally
h
units.
::水平移动h单位。 -
If
a
>
1
,
stretch
vertically
by a
factor
of
a
units.
::如果 a>1, 则垂直延伸为单位的因数。 -
If
0
<
a
<
1
, shrink vertically by a factor of
a
units.
::如果 0<a<1, 则垂直缩减为单位的因数 。 -
If
a
<
0
, reflect across the
x
-axis and then
stretch or shrink by a factor of
a
units.
::如果 a<0 反射 X 轴,然后拉伸或缩小一个单位的因数。 -
Shift vertically
k
units.
::垂直移动 K 单位 。
The characteristics of the squaring family of functions, the quadratic function in standard form, and the parabola can be applied :
::函数的方形组合、标准形式的二次函数和抛物线的特性可以适用于:-
The graph has a vertex at
(
h
,
k
)
=
(
−
b
2
a
,
f
(
−
b
2
a
)
)
.
::该图在(h,k)=(-b2a,f(-b2a))上有一个顶点。 -
The axis of
is the line that passes through the vertex,
x
=
h
, that creates two symmetric halves of the parabola.
::轴是横穿顶端的线, x=h, 产生双对称的抛物线半径。 -
The function has a
y
-
intercept
at
(
0
,
c
)
and
zeros
at
(
−
b
+
√
b
2
−
4
a
c
2
a
,
0
)
and
(
−
b
−
√
b
2
−
4
a
c
2
a
,
0
)
. If the zeros are real, then they are the
x
−
intercepts
.
::函数在(0,c)和0(-bb2-4ac2a,0)和(-bb2-4ac2a,0)和(-bb2-4ac2a,0)上有一个 Y- 界面。如果零是真实的,那么它们是 x- 界面。 -
The graph is
symmetrical
about the
vertical
line,
x
=
h
, called the axis of symmetry.
::图表对称垂直线 x=h, 称为对称轴 。 -
The function has an extreme value,
k
, which occurs when
x
=
h
.
::函数有一个极端值k,当 x=h 时即为k。 -
If
a
<
0
:
-
The function has an absolute
maximum.
::函数具有绝对上限。 -
The
domain
is
(
−
∞
,
∞
)
,
and the
range
is
(
−
∞
,
k
]
.
::域名是 (,,) , 范围是 (,k) 。 -
The graph increases on
(
−
∞
,
h
)
and decreases on
(
h
,
∞
)
.
:,h) 上的图表增加和
上的图表减少。
-
The end behavior is
lim
x
→
∞
f
(
x
)
=
−
∞
and
lim
x
→
−
∞
f
(
x
)
=
−
∞
.
::最后的行为是 limxf(x)和limxf(x)。
::如果 a < 0 : 函数具有绝对最大值。 域是 (, ), 范围是 (, k) 。 图表上增加 (, h) , 下减少 -
The function has an absolute
maximum.
-
If
a
>
0
:
-
The function has an absolute
minimum.
::该函数具有绝对最低值。 -
The domain is
(
−
∞
,
∞
)
,
and the range is
[
k
,
∞
)
.
::域是 (,) , 范围是 [k,] 。 -
The graph decreases on
(
−
∞
,
h
)
and increases on
(
h
,
∞
)
.
: -
The end behavior is
lim
x
→
∞
f
(
x
)
=
∞
and
lim
x
→
−
∞
f
(
x
)
=
∞
.
::最后的行为是 limxf(x)和limxf(x)。
::如果 a>0 : 函数有绝对最小值。 域是 (, ) , 范围是 [k, ) 。 图表下移 (, h) 和增加 (h, ) 。 结束行为是 limxf(x) 和 limxf(x) 。 -
The function has an absolute
minimum.
Examples
::实例Example 1
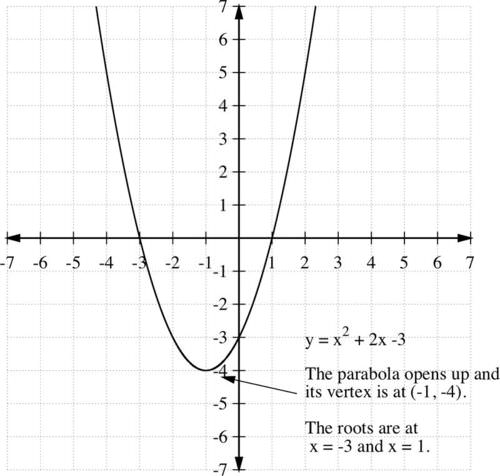
::例1Sketch the graph of the function y = f ( x ) = x 2 + 2 x − 3.
::绘制函数 y=f(x) =x2+2x-3 的图形 。Solution:
::解决方案 :Step 1: For the y − intercept, ( 0 , f ( 0 ) ) = ( 0 , − 3 ) .
::第1步:Y-拦截,(0,f(0))=(0,-3)。For the x − intercepts, solve
::x- 界面, 解解x 2 + 2 x − 3 = 0 ( x + 3 ) ( x − 1 ) = 0 x = − 3 , 1.
::x2+2x-3=0(x+3)(x-1)=0x%3,1。Therefore , the x − intercepts are (-3, 0) and (1, 0).
::因此,X-拦截是(3,0)和(1,0)。Step 2: The vertex (extreme point) is at
::第2步:顶端(极端点)为x = − b 2 a = − 2 2 ( 1 ) = − 1
::#############################################################################################################1#######1#############################1####################################1#####################################################################################################################################################################################################################################################################################################################################and
::和f ( − 1 ) = ( − 1 ) 2 + 2 ( − 1 ) − 3 = − 4 ,
::f(-1)=(-1)2+2(-2)-1-34,so the vertex is (-1, -4).
::顶部是 (-1, 4) 。Step 3: Since the coefficient of x 2 is positive, a > 0 , the extreme point is a minimum and the parabola opens up. The domain is ( − ∞ , ∞ ) , and the range is [ − 4 , ∞ ) .
::第3步:由于x2系数为正值,因此 > 0, 极端点为最小值, 抛物线打开。 域是 (, , ) , 范围是 [ - 4, ] 。Step 4: Plot these values and sketch a smooth parabola:
::步骤4:绘制这些数值并绘制一个光滑的抛物线:Example 2
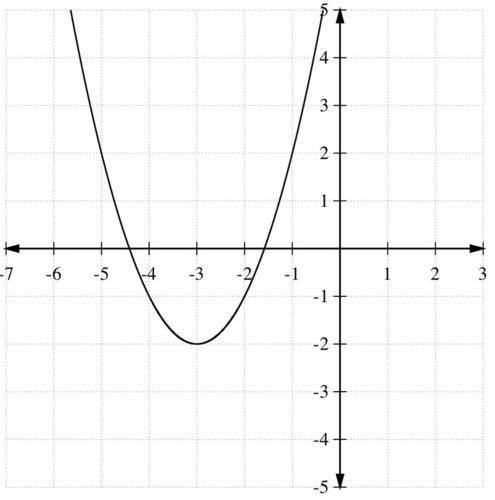
::例2Rewrite the quadratic g ( x ) = x 2 + 6 x + 7 in vertex form and then graph.
::以顶点形式重写二次方位 g( x) =x2+6x+7, 然后绘制图形 。Solution:
::解决方案 :Step 1: Rewrite the given quadratic in vertex form.
Use the technique of to write the function in vertex form. Add and subtract ( b 2 ) 2 to the righthand side of the equation :
::第1步:以顶点形式重写给定的二次曲线。使用以顶点形式写入函数的技术。在方程式右侧添加和减去(b2)2:g ( x ) = x 2 + 6 x + 7 = x 2 + 6 x + 9 + 7 − 9.
::g(x) =x2+6x+7=x2+6x+9+7-9。Group the 1st three terms on the right side of the equation and factor these terms:
::组合方程右侧的第1三个条件组,并将这些条件乘以:g ( x ) = ( x 2 + 6 x + 9 ) + 7 − 9 = ( x + 3 ) 2 − 2.
::g(x)=(x2+6x+9)+7-9=(x+3)2-2。Thus, a = 1 and the vertex of this parabola is (-3, -2).
::因此,a=1和这一抛物线的顶部是(-3-2)。Step 2: Use the vertex to determine the minimum and the range.
::第2步:使用顶点确定最小值和范围。The function has a minimum value of -2 at x = - 3 . The domain is ( − ∞ , ∞ ) , and the range is [ − 2 , ∞ ) .
::此函数在 x= 3 时的最小值为 - 2。 域是 (, ) , 范围是 [-2, ] 。Step 3: Determine the intercepts.
::步骤3:确定拦截次数。For the y -intercept, ( 0 , g ( 0 ) ) = ( 0 , 7 ) . For the x -intercept, solve: 0 = x 2 + 6 x + 7 to obtain ( − 3 + √ 2 , 0 ) and ( − 3 − √ 2 , 0 ) .
::y 界面, (0, g(0)) = (0, 7) 。 x 界面, 解答: 0=x2+6x+7 获取 (- 32, 0) 和 (- 32, 0) 。Step 4: Examine the leading coefficient , a = 1 , which is positive, so the parabola opens up.
::第4步:审查主要系数a=1,是正数,因此抛物线打开。Step 5: Plot these values and sketch a parabola:
::步骤5:绘制这些数值并绘制一个抛物线:Example 3
::例3For H ( t ) = − 1 2 t 2 + 8 t + 54 , which models the height of a balloon launched from a height of 54 feet at t = 0 , use the intercepts, vertex, and symmetry to explain why:
::H(t)12t2+8t+54,该气球从54英尺高度T=0时发射,该气球的高度为54英尺,该气球的高度为T=0,使用拦截、顶部和对称来解释原因:-
It is launched from a height of 54 feet.
::它从54英尺高处发射 -
Its domain is
0
≤
t
≤
21
and the range is
0
≤
H
(
t
)
≤
86
.
::其域为 0t21, 范围为 0H( t)86。 -
The maximum height is 86 feet and that level is attained once.
::最高高度为86英尺,达到这一水平一次。
Solution:
::解决方案 :Step 1: For the y -intercept, ( 0 , H ( 0 ) ) = ( 0 , 54 ) . This means that the height of the balloon is 54 feet when the balloon is launched.
::第1步: Y 接口, (0, H (0)) = (0, 54). 这意味着气球发射时的高度为54英尺。For the x -intercepts, solve
::对于 X 界面, 解解0 = − 1 2 t 2 + 8 t + 54 0 = t 2 + 16 t + 54 t = 8 ± 2 √ 43 .
Since negative time does not make sense, the only intercept that makes sense is ( 8 + 2 √ 43 , 0 ) ≈ ( 21.1 , 0 ) . The domain of a quadratic function is ( − ∞ , ∞ ) and must be restricted for this problem to [ 0 , 21.1 ] . The balloon is launched when t = 0 seconds and lands when t ≈ 21.1 seconds.
::012t2+8t+540=t2+16t+54t=8243。由于负时间不合理,唯一有意义的拦截是 (8+243,0)\\\\(211.0)\\\\\\\\\\\\\\\\\\\\\\\\\\\\\\\\\\\\\\\\\\\\\\\\\\\\\\\\\\\\\\\\\\\\\\\\\\\\\\\\\\\\\\\\\\\\\\\\\\\\\\\\\\\\\\\\\\\\\\\\\\\\\\\\\\\\\\\\\\\\\\\\\\\\\\\\\\\\\\\\\\\\\\\\\\\\\\\\\\\\\\\\\\\\\\\\\\\\\\\\\\\\\\\\\\\\\\\\\\\\\\\\\\\\\\\\\\\\\\\\\\\\\\\\\\\\\\\\\\\\\\\\\\\\\\\\\\\\\\\\\\\\\\\\\\\\\\\\\\\\\\\\\\\\\\\\\\\\\\\\\\\\\\\\\\\\\\\\\\\\\\\\\\\\\\\\\\\\\\\\\\\\\\\\\\\\\\\\\\\\\\\\\\\\\\\\\\\\\\\\\\\\\\\\\\\\\\\\\\\\\\\\\\\\\\\\\\\\\\\\\\\\\\\\\\\\\\\\\Step 2: The vertex is at ( − 8 2 ( − 1 2 ) , H ( − 8 2 ( − 1 2 ) ) ) = ( 8 , 86 ) . This is the single extreme point.
::第2步:顶点在(- 82(- 12), H(-82( -12)) =( 8,866). 这是唯一的极端点。Step 3: The leading coefficient is negative, so the parabola opens downward. The extreme point is a local maximum and an absolute maximum. The function increases on the interval ( 0 , 8 ] and decreases on the interval [ 8 , 21.1 ) . Since the function increases and then decreases, the maximum height of 86 feet is achieved exactly once.
::第3步:主要系数为负数,因此抛物线向下开放。极端点为本地最大值和绝对最大值。函数在间隔(0.8)上增加,在间隔(8.211)下减少。由于函数增加,然后下降,86英尺的最高高度完全达到一次。Example 4
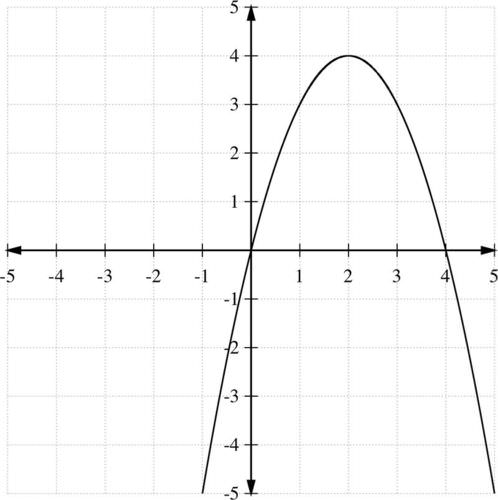
::例4Sketch the graph of the quadratic function f ( x ) = − x 2 + 4 x .
::绘制二次函数 f( x) x2+4x 的图形 。Solution:
::解决方案 :Step 1: The y − intercept is at ( 0 , f ( 0 ) ) = ( 0 , 0 ) . For the x − intercept, solve
::第1步:y- 界面在 0,f(0) =(0) =(0) 。 对于 x- 界面, 解答− x 2 + 4 x = 0 − x ( x − 4 ) = 0 x = 0 , 4.
::-x2+4x=0-x(x-4)=0x=0.4。( 0 , 0 ) and ( 4 , 0 ) are the x − intercepts.
:Step 2: The vertex is
::第2步:顶端是( h , k ) = ( − b 2 a , f ( − b 2 a ) ) ( h , k ) = ( 2 , 4 ) .
:Step 3: a = − 1 , so the parabola opens down and the maximum value is 4 and occurs at x = 2 .
::第3步: a1, 因此抛物线向下打开, 最大值为 4, 并在 x=2 时发生 。The domain is ( − ∞ , ∞ ) and the range is ( − ∞ , 4 ] .
::域是 (,) , 范围是 (, ) , 范围是 (, 4) 。Step 4: Finally, the graph can be obtained by sketching a parabola through the points determined above. Note that the axis of symmetry, x = 2 , would divide this parabola evenly in half.
::步骤4:最后,通过上述确定的点绘制抛物线图,可以取得该图。请注意,对称轴x=2将把该抛物线平均地平分一半。Example 5
::例5A golf ball is shot from the ground level.
::一个高尔夫球是从地面发射的
Its height is given by h ( t ) = 121 t − 4.9 t 2 , where t is the time in seconds and h ( t ) is the height of the golf ball (in meters) above the ground at time t . Find:
::其高度由 h(t) = 121t-4.9t2给定,其中 t 是秒中的时间, h(t) 是时间 t 上方地面高尔夫球(米)的高度。-
h
when
t
=
1
second,
::h 当t=1秒时, -
the maximum height reached by the ball, and
::球达到的最大高度,以及 -
the graph of the trajectory of the
ball.
::球的轨迹图。
Solution:
::解决方案 :Step 1: At t = 1 second, h ( 1 ) = 121 ( 1 ) − 4.9 ( 1 ) 2 = 121 − 4.9 = 116.1 meters.
::第1步:t=1秒,h(1)=121(1)-4.9(1)2=121-4.9=116.1米。Step 2: To find the maximum height reached by the ball , the vertex is
::第2步:为了找到球所达到的最大高度,顶部是( t , h ( t ) ) = ( − ( 121 ) 2 ( − 4.9 ) , f ( − ( 121 ) 2 ( − 4.9 ) ) ) ( t , h ( t ) ) = ( 12.3 , h ( 12.3 ) ) ( t , h ( t ) ) = ( 12.3 , 121 ( 12.3 ) − 4.9 ( 12.3 ) 2 ) ( t , h ( t ) ) = ( 12.3 , 747 ) .
:The maximum height is reached at time 12.3 seconds. T he maximum height is approximately 747 meters.
::最高高度为12.3秒,最高高度约为747米。Step 3: To graph the function accurately, the t − intercepts are found:
::第3步:为准确绘制函数图,发现 t- 界面:121 t − 4.9 t 2 = 0 ( 121 − 4.9 t ) t = 0.
::121-4.9t2=0(121-4.9t)t=0。And the t − intercepts are at 0 seconds and approximately 24.7 seconds.
::和t - 拦截是0秒 大约24.7秒。The h − intercept is ( 0 , h ( 0 ) ) = ( 0 , 0 ) .
::h - 拦截是 (0,h(0)) = (0,0) 。Since the leading coefficient is negative, the parabola opens down. From this information, construct the graph. Notice that the graph illustrates that the domain is and the range is [ 0 , 747 ] :
::由于主要系数为负值, 抛物线向下打开。 在此信息中, 构建图形 。 请注意, 图显示域为 [ 0. 24.7 , 范围为 [ 0. 747 :
Example 6
::例6Find the quadratic function in factored form with the x − intercepts ( − 7 , 0 ) and ( 3 , 0 ) . The quadratic function also passes through the point ( − 1 , 48 ) .
::在 X- intercuts (- 7,0) 和 (3,0) 中以系数形式查找二次函数。 二次函数也通过点(-1,48) 。Solution:
::解决方案 :Step 1: Use the factored form
::第1步:使用因素化形式f ( x ) = a ( x − ( − 7 ) ) ( x − 3 ) = a ( x + 7 ) ( x − 3 ) .
:Step 2: Since the point ( − 1 , 48 ) is on the graph,
::第2步:由于点(-1,48)在图中,48 = a ( − 1 + 7 ) ( − 1 − 3 ) 48 = a ( − 24 ) a = − 2.
::48=a(-1+7)(-1-3)48=a(-24)a2。Step 3: f ( x ) = − 2 ( x + 7 ) ( x − 3 ) .
::第3步:f(x)2(x+7)(x-3)。Summary
::摘要-
Quadratic functions are a special type of polynomial with forms:
-
Standard form:
f
(
x
)
=
a
x
2
+
b
x
+
c
::标准窗体: f( x) = 轴2+bx+c -
Vertex form:
f
(
x
)
=
a
(
x
−
h
)
2
+
k
::vertex 窗体: f(x)=a(x-h)2+k -
Factored form:
f
(
x
)
=
a
(
x
−
r
1
)
(
x
−
r
2
)
::乘数表: f(x)=a(x-r1)(x-r2)
::二次曲线函数是一种特殊形式的多圆形函数:标准形式: f(x) = ax2+bx+c Vertex 形式: f(x) = a(x-h) 2+k 系数形式: f(x) = a(x-r1)(x-r2) -
Standard form:
f
(
x
)
=
a
x
2
+
b
x
+
c
-
Quadratic functions have one extreme value located at the vertex,
(
h
,
k
)
=
(
−
b
2
a
,
f
(
−
b
2
a
)
)
.
::二次曲线函数在顶部(h,k) = (-b2a,f(-b2a)) 上有一个极端值。 -
The graph of a quadratic function is a parabola, which opens up if
a
>
0
and down if
a
<
0.
::二次函数的图形是抛物线,如果 a>0 开始,则该图向上打开,如果 a<0 开始,则向下打开。
Review
::回顾-
What is the U-shaped graph of a quadratic function called?
::二次函数的 U 形状图形叫什么 ? -
Which direction does a parabola open if the leading coefficient (
a
) is positive?
::如果主要系数(a)为正数,抛物线会打开哪个方向? -
For
y
2
=
x
, if the coefficient of
y
is positive, which way does the parabola open?
::对于y2=x,如果y的系数是正数, 抛物线以哪一种方式打开? -
What is the name of the lowest point of a parabola that opens up, and the highest point of a parabola that opens down?
::开启的抛物线最低点和开启的抛物线最高点的名称是什么? -
What is the name of the line passing through the vertex that divides the parabola into two symmetric parts?
::穿过将抛物线分为两个对称部分的顶端的线条的名称是什么? -
Sketch the graph of
y
=
x
2
+
3
.
::绘制 y=x2+3 的图形。 -
Sketch the graph of
y
=
−
x
2
+
4
x
−
4
.
::绘制 yx2+4x-4 的图形 。 -
Sketch the graph of
y
=
2
x
2
+
8
x
.
::绘制 y= 2x2+8x 的图形 。 -
Consider the following quadratic function:
y
=
−
x
2
−
2
x
+
1
. a) Which direction does it open? b) What is the vertex? c) Is it
transformed
in any way?
::考虑以下二次函数 : yx2-2x+1. a) 它打开了哪个方向? b) 顶点是什么? c) 它是否以任何方式发生了转变? -
Consider the quadratic functions:
y
=
2
x
2
,
y
=
4
x
2
,
y
=
6
x
2
. Which quadratic function would you expect to have the narrowest parabola? Explain your answer.
::考虑四边函数 : y= 2x2, y= 4x2, y= 6x2。 您希望哪个四边函数具有最窄的抛物线? 请解释您的答复 。
Sketch the graph of each function:
::绘制每个函数的图形 :-
y
=
−
x
2
::yx2 -
y
=
3
x
2
+
6
x
+
1
::y=3x2+6x+1 -
y
=
1
2
x
2
+
2
x
+
4
::y=12x2+2x+4 -
y
=
(
x
−
3
)
2
+
4
::y=(x-3)2+4 -
y
=
−
x
2
−
8
x
−
17
::yx2 - 8x - 17
For questions 16-19, refer to the following scenario:
::关于问题16-19,请参考以下假设情况:The quadratic function y = − 0.05 x 2 + 1.5 x can be used to represent the path of a football kicked 30 yards down the field. The variable x represents the distance, in yards, the ball has traveled down the field. The height, in yards, of the football in the air is represented by the variable y.
::二次函数 y 0.05x2+1.5x 可以用来代表足球在球场下30码处踢球的路径。 变量 x 代表球在球场上的距离。 球在球场上的高度由变量 y 表示。Use the quadratic function to calculate the height of the ball as it travels down the field. Round your answers to the nearest hundredth of a yard.
::使用二次曲线函数来计算球在田间行走时的高度。 将您的答案绕到最接近的百分百的院子 。Distance Down the Field (yds) Height in the Air (yds) 0.0 5.0 10.0 15.0 20.0 25.0 30.0 -
What is the maximum height of the football during the kick?
::足球踢球时最高身高是多少? -
How far down the field has the football traveled when it reaches its maximum height?
::足球到达最高高度时 球场下方的足迹有多远? -
Use the information in the table to graph the path of the football kick.
::使用表格中的信息来绘制足球踢的路径图。 -
If you were shown only the graph of this quadratic function, how could you determine the maximum height of the football during the kick, and how far down the field the football has traveled when it reaches its maximum height?
::如果只显示您这个二次函数的图形, 您如何确定足球在踢球时的最高高度, 以及足球到达最高高度时在球场下方所走过的路程 ?
Review (Answers)
::回顾(答复)Please see the Appendix.
::请参看附录。Resources
::资源Technological Tools
::技术工具You can graph quadratic functions using your computer's graphing program or with a TI-83/84 calculator. Below are basic directions for graphing a quadratic function and finding the vertex and x − intercepts, or zeros, using the functions on a TI-83 or TI-84 graphing calculator:
::您可以使用您的计算机的图形化程序或使用 TI-83/84 计算器来绘制二次函数。以下是图形化二次函数的基本方向,并使用 TI-83 或 TI-84 图形化计算器上的函数来查找顶点和 x- 界面或零:-
E
nter the function using the
Y
=
button.
::使用 Y= 按钮输入函数。 -
Set a standard window with
ZOOM-6
to view the graph.
Adjust the
window using the
WINDOW
menu. Use the
y
−
intercept to help you find the best values for
XMAX, XMIN, YMAX, YMIN,
and the
X
−
and
Y
−
scales for viewing the graph of the parabola.
::使用 ZOOM-6 设置标准窗口查看图形。 使用 WINDOW 菜单调整窗口。 使用 y- interception 帮助您找到 XMAX、 XMIN、 YMAX、 YMIN、 YMIN 和 X- 和 Y- 比例尺的最佳值, 用于查看 parbola 的图形 。 -
Press
GRAPH
.
::请按GRAPH。 -
Adjust and refine the view using
ZOOM
or by changing the
WINDOW
settings.
::使用 ZOOM 或修改 WINDOW 设置来调整和精细视图 。
Finding the Vertex
::查找 VertexYou can use functions built into the calculator to find the vertex of any parabola you graph:
::您可以使用计算器中所含的函数查找图中任何抛物线的顶点:-
Follow the directions above to graph a quadratic function.
::沿着上方方向绘制二次函数图。 -
From the Graph screen, press
2ND TRACE
(this is the
CALC
Menu).
::从图示屏幕上按 2ND TRACE (这是 CALC 菜单) 。 -
Scroll down and choose
MINIMUM
or
MAXIMUM
.
::向下滚动并选择 MINIMUM 或 MAXIMUM 。 -
The calculator prompts
LEFT BOUND
? Use the arrow keys (< or >) to place the cursor to the left of the vertex, and press
ENTER.
::计算器会提示 LEFT BOUND ? 使用箭头键 ( < 或 > ) 将光标置于顶点左侧, 按 ENTER 键 。 -
The calculator then prompts
RIGHT BOUND
? Use the arrows to place the cursor to the right of the vertex and press
ENTER
.
::计算器然后按右键键 ? 使用箭头将光标置于顶端右侧并按 ENTER 键 。 -
Finally, the calculator will prompt for a guess with
GUESS
?
P
ress
ENTER
again.
::最后,计算器将促使人们猜测 与猜测?再次按Engter。 -
The calculator will display the
x
−
and
y
−
coordinates of the vertex.
::计算器将显示顶点的 x - 和 y - 座标 。
Finding the Zeros
::寻找零点-
From the Graph screen, press
2ND TRACE
(This is the
CALC
Menu).
::从图示屏幕上按 2ND TRACE (这是 CALC 菜单) 。 -
Choose
ZERO
.
::选择ZERO。 -
The calculator prompts
LEFT BOUND
? Use the arrow keys (< or >) to place the cursor to the left of the zero and press
ENTER
.
::计算器会提示 LEFT BOUND ? 使用箭头键 ( < 或 > ) 将光标放在零点的左边, 按 ENTER 键 。 -
The calculator then prompts
RIGHT BOUND
? Use the arrows to place the cursor to the right of the zero and press
ENTER
.
::计算器然后按右键键 ? 使用箭头将光标置于零向右方并按 ENTER 键 。 -
Finally, the calculator will prompt for a guess with
GUESS
?
P
ress
ENTER
again.
::最后,计算器将促使人们猜测 与猜测?再次按Engter。 -
The calculator will display the
x
−
coordinate of the zero (x-intercept).
::计算器将显示零的 x- 坐标( X 界面) 。 -
Repeat steps 1-6 to find the other zero of the function.
::重复步骤 1-6 查找函数的其他零。
-
Standard form:
f
(
x
)
=
a
x
2
+
b
x
+
c
,
where
a
,
b
, and
c
are real numbers and
a
≠
0
.