1.6 指数模型介绍-interactive
章节大纲
-
The Purpose of this Lesson
::本课程的目的In this section you will explore scenarios which are modeled with and ex plore some of the basic characteristics of exponential functions.
::在本节中,您将探讨与指数函数的一些基本特点为模型的设想情况,并探讨指数函数的一些基本特点。
Activity 1: Exponential Functions
::活动1:指数职能Example 1-1
::例1-1A scientist is cultivating bacteria in a petri dish. On day zero, there is only one bacteria in the dish. The bacteria double each day, so on day one, there are two bacteria. How many are on day three, day four, and so on? In the table below, what do and represent? Extend the table to at least day five and create a graph. How many bacteria will there be on day ten? On what day will there b e more than a million bacteria? Is this a linear function ? How do you know?
::科学家正在培植一种花生菜中的细菌。 第0天, 盘子里只有一个细菌。 细菌每天加倍, 所以第一天, 有两个细菌。 第三天有多少细菌, 第四天, 等等? 在下面的表格中, x 和 y 代表什么? 将表格扩大到至少第五天, 并绘制一个图表。 第10天有多少细菌? 什么时候会有超过一百万个细菌? 这是一条线性功能吗? 你怎么知道? xy0112Solution: Here is the table, extended to an -value of 5:
::解决办法:这是表格,扩展至x值5:
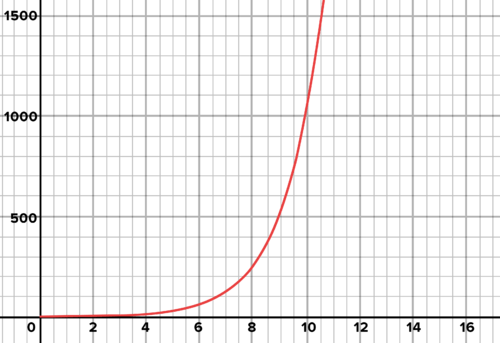
::xy01122438416532Below is the graph, with the y-axis scaled from 0 to 1500.
::下面是图表,Y轴从0升至1500。Bacteria multiply exponentially in a petri dish
::细菌成倍地成倍地成倍地成倍地在一种小菜盘中成倍地成倍地成倍地成倍地成倍地成倍地成倍地成倍地成倍地成倍地To determine the number of bacteria on day 10, you can use a calculator or the table below to keep doubling the prior number of bacteria in the table for each day, until you get the value for day 10. Each -value in the table is twice the previous one:
::为了确定第10天的细菌数量,您可以使用计算器或下表将每天表中的细菌数量翻一番,直到你得到第10天的值。 表格中的每个y值是前1天的两倍:x01121234384841653266471288256951211024。If you continue doubling with a calculator, you will find that on day 20 there are 1,480,576 bacteria, which is more than a million!
This function is not linear. The graph of a linear function is a line, and this graph curves. Also remember that, for , the between any two points is the same regardless of the points chosen. However, with this function, calculating the slope between consecutive points in the table gives you an increasing slope. This increase in slope is also represented in the graph.
::如果您继续使用计算器加倍计算, 将会发现在第20天有1, 480, 576种细菌, 超过100万。 此函数不是线性函数。 线性函数的图形是一个线性函数, 和这个图形曲线。 还要记住, 对于 , 任何两个点之间的曲线都是相同的, 不论选择的点。 但是, 有了这个函数, 计算表格中连续点之间的斜度会使您有一个递增的斜度。 斜度的增加也会在图形中显示 。Example 1-2
::例1-2Imagine the same scenario as above, but instead of starting with 1 bacteria on day 0, there are 45. The bacteria still double each day. Each of the tables below expresses the change in the number of bacteria over time. Each table emphasizes a different feature of this change. What features does each table emphasize? Use the last table to describe a general rule for finding the number of bacteria after days.
::想象一下与上述情景相同的情景,但是没有从第0天的1个细菌开始,而是有45个细菌,这些细菌每天仍然翻一番。以下各表显示了细菌数量随时间变化的变化。每个表格都强调了这一变化的不同特点。每个表格强调的是哪些特点?使用最后一个表格来描述在X天之后查找细菌数量的一般规则。Table A Table B Table C
::解决方案 : 第一个表格显示细菌数量没有以恒定速度增长。 表格中连续的y值之间的差值随着 x 的增加而增加。 第二个表格显示,细菌数量每天比先前的值翻倍。 第三个表格显示了另一种思考方法, 即翻倍。 一天后, 45 细菌的初始值翻了一番。 两天后, 初始值翻了一倍。 等等 。
::工作出来-
Use the table to answer the following questions. After 4 days,
by how much
has the initial value been
multiplied
? After 9 days?
::使用表格回答下列问题。 4天后, 最初值乘以多少? 9天后? xy045145_ 2245_ 2}2345}}2}2}2}2445}2}2}2}2}2}2}2}2}2}2}2}2}2}2}2}2}2}2}2}2} -
Without performing any
multiplication
, rewrite the numerical
expression
below in a simpler form. In the context of the current scenario (bacteria, initial value of 45 on day 0), what does this numerical expression represent?
::在不执行任何乘法的情况下, 重写下面的数值表达式, 以更简单的形式 。 在当前的假设情景中( 细菌, 最初值为45 / day / day) , 这个数字表达式代表什么 ? 45 = 2 =2 =2 =2 =2 =2 =2 =2 =2 =2 =2 =2 =2 =2 =2 =2 =2 =2 =2 =2 =2 =2 =2 =2 =2 =2 =2 =2 =2 =2 =2 =2 =2 =2 =2 =2 =2 =2 =2 =2 =2 =2 =2 =2 =2 =2 =2 =2 =2 -
What is the value of each of the following numerical expressions? Explain these results. What does the
exponent
represent in each case? Interpret these computations in the context of the current scenario (bacteria doubling, initial value of 45 on day 0).
::下面每个数字表达式的值是多少? 请解释这些结果。 列表在每种情况下代表什么? 在目前假设情景中解释这些计算( 细菌翻一番, 最初值在0天为45) 45 (2)245 (2)145 (2)0)
Example 1-3
::例1-3Another scientist is cultivating bacteria in a petri dish. The following equation represents the number of bacteria, , in the petri dish after days. Use the equation to create a table. What does represent? What does represent? What does 70 represent? What does 2 represent? Why is in the exponential position? Sketch the graph. Does the parameter 70 show up in the graph? Where? Why?
::另一位科学家正在培植一种花生盘中的细菌。 以下方程式代表了x天后在花生盘中的细菌数量。 使用方程式创建一张表格。 x 代表什么? 70 代表什么? 70 代表什么? 70 代表什么? 2 代表什么? 2 代表什么? 为什么 x 在指数位置? 绘制图。 参数 70 在图表中是否显示? 在哪里? 为什么?
::y=70(2)xSolution: is the number of days and is the bacterial count. 70 is the initial bacteria count at 0 days. The 2 represents the doubling of the bacteria each day. is in the exponential position because the exponent tells you the number of times the bacteria doubles. The 70 shows up on the graph as the - intercept .
::解答 : x 是天数, y 是细菌数 。 70 是最初的细菌计数为0天。 2 表示细菌每天翻一番。 x 处于指数位置, 因为指数告诉您细菌翻倍的次数。 70 显示在图中作为 Y 探测 。
::{\fn黑体\fs22\bord1\shad0\3aHBE\4aH00\fscx67\fscy66\2cHFFFFFF\3cH808080}... {\fn黑体\fs22\bord1\shad0\3aHBE\4aH00\fscx67\fscy66\2cHFFFFFF\3cH808080}... {\fn黑体\fs22\bord1\shad0\3aHBE\4aH00\fscx67\fscy66\2cHFFFFFF\3cH808080}... {\fn黑体\fs22\bord1\shad0\3aHBE\4aH00\fscx67\fscy66\2cHFFFFFF\3cH808080}... {\fn黑体\fs22\bord1\shad0\3aHBE\4aH00\fscx67\fscy66\2cHFFFFFF\3cH808080}Exponential Functions
::指数函数Simple e xponential functions take the form .
::简单指数函数为y=a(b)x。If increases by consecutive integers , tells us the corresponding multiplicative increase in the -values. We call this value the multiplier .
::如果 x 以连续整数增加, b 告诉我们 Y 值的相应倍增。 我们称这个值为乘数 。is the initial value returned for the function for an -value of 0. It's the -intercept for the graph.
::a 是返回函数的初始值,为 0 的 x 值。它是图形的 Y 界面。
Activity 2 : Compare Exponential and Linear Functions
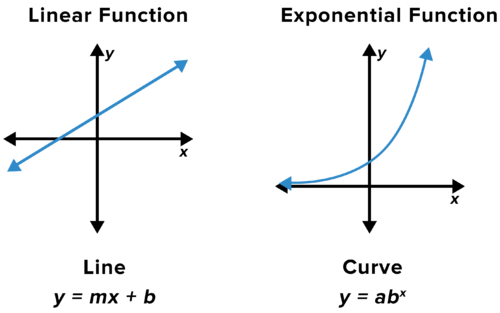
::活动2:比较指数函数和线性函数Linear and Exponential Functions
::线性函数和指积函数Work it Out
::工作出来-
What is
slope-intercept form
for a line? What does each parameter (
and
), represent? What is the form for a simple
exponential function
? What does each parameter (
and
) represent? How are these two functions different? How are they similar?
::直线的斜度截断形式是什么? 每个参数( m 和 b) 代表什么? 简单的指数函数的形式是什么? 每个参数( a 和 b) 代表什么? 这两个函数如何不同? 它们如何相似 ? -
Several scenarios are given below. Identify each as best modeled by a linear function, an exponential function, or neither. Explain your choice. You may suggest an equation to support your argument.
-
A gym membership costs $50 to
open
then $25 per month thereafter.
::健身馆会员费50美元开张,其后每月25美元。 -
The number of kids at a theme park triples every hour.
::主题公园里的孩子数 每小时三倍 -
In the year 2000, an apple cost 10 cents. Today, it costs 50 cents.
::2000年,苹果花10美分,今天花50美分 -
A rocket accelerates from the surface of the moon.
::一枚火箭从月球表面加速 -
A car is driving at a constant
speed
. It's
odometer reading
as a function of time is given by the equation
.
::一辆汽车以恒定速度行驶。 公式y=55x+130给出了以时间函数计算的千兆米读数。 -
A sandwich shop makes 24 sandwiches per hour.
::三明治店每小时做24个三明治 -
A rock is dropped from a cliff.
::一块石头从悬崖上掉下来 -
Every year, a sandwich shop doubled its profits.
::每年,一家三明治店的利润都翻了一番。 -
The more money a car manufacturer spends on advertising, the more cars they sell.
::汽车制造商花在广告上的钱越多 他们卖的汽车越多 -
The more rainfall there is in the morning, the more students are late to school.
::早上降雨量越多,学生上学迟到越多。 -
A plane descends 2 meters
vertically
for every 5 meters of horizontal movement.
::每水平移动5米,一架飞机垂直下降2米。 -
In the springtime, the number of ants in a colony quadruples every week.
::春天,一个殖民地内每星期的蚂蚁数量 翻了四番 -
In the fall, the number of leaves on a particular tree is halved every week.
::秋天,每星期将树上的叶子减少一半。
::下面给出了几种情景。 确定每个模型都是由线性函数、 指数函数或两者都不是最好的模型。 解释您的选择 。 您可以建议一个公式来支持您的论点 。 一个健身俱乐部的会员资格需要50美元才能开放, 然后每月25美元。 一个主题公园的儿童人数每小时三倍。 2000年, 一个苹果花10美分。 今天, 它花费50美分。 一个火箭从月球表面加速。 一辆汽车正在以恒定速度驾驶。 乘以时间函数的超强计读数由等式 y=55x+130 给出。 一个三明治店每小时24个三明治。 一块石头从悬崖上掉下来。 每年, 一个三明治店将利润翻一番。 一个汽车制造商花在广告上的钱越多, 他们卖的汽车也越多。 早上降雨越多, 学生越晚上学越晚。 每5米水平运动的飞机垂直下降2米。 每星期, 一个聚居区的蚂蚁数将翻四番。 在秋季, 一个树上的叶数每星期减少一半。 -
A gym membership costs $50 to
open
then $25 per month thereafter.
Interactive
::交互式互动Use the interactive to explore how changing the parameters of an exponential function changes the behavior of the function. Move the red point along the red slider to change the initial value. Move the blue point along the blue slider to change the multiplier. How does changing each parameter change the shape of the graph? Why?
::使用互动来探索指数函数参数的变化如何改变函数的行为。 沿着红色滑块移动红色点以改变初始值。 沿着蓝色滑块移动蓝色点以改变乘数。 改变每个参数如何改变图形的形状? 为什么?Example 2-1
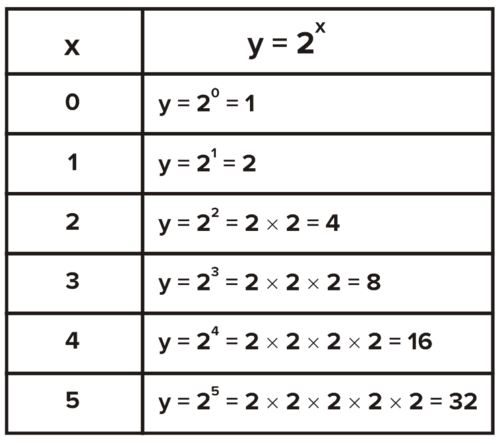
::例2-1Make a table and graph the exponential function, Be sure that your table starts with an -value of 0 and extends at least to an -value of 5. Graph the function with a smooth curve as in the example above.
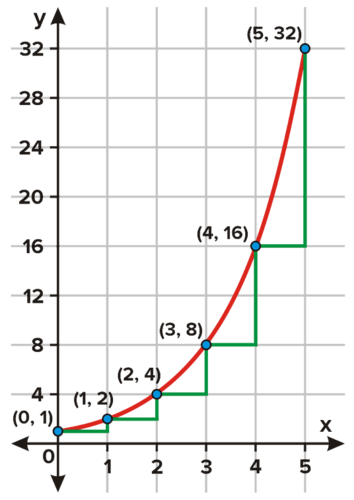
::绘制表格并绘制指数函数, y=2x。 请确定您的表格以 0 x 值开头, 并至少延伸至 x 值 5 。 如上例所示, 用光滑曲线绘制函数 。Draw segments connecting consecutive points in the table you made. Find the slope between these points, and write the slope that corresponds to each segment. What do you observe?
::绘制您在表格中连接连续点的段。 查找这些点之间的斜度, 并写入与每个段对应的斜度。 您观测到什么 ?Solution: Here is the table and graph of the function for to
::解析度: 这是 x=0 到 x=5 函数的表格和图表 。Notice the slopes are also exponential. The slopes for lines between points in the table are:
::注意斜坡也是指数化的。 表格各点间线的斜坡是 :-
::x=0 到 x=11:m=1 -
::x=1 到 x=2: m=2 -
::x=2 到 x=3: m=4 -
::x=3 到 x=4: m=8 -
::x=4 到 x=5: m=16
Interactive
::交互式互动Use the interactive below to explore the slope of segments between points on an exponential function. Change the parameters to see how it influences any patterns you see in the slope. Write and share your observations.
::使用下面的交互作用来探索指数函数上的点点之间段段的斜坡。 更改参数以查看它如何影响您在斜坡中看到的任何模式。 写入并分享您的观察结果 。Summary
::摘要-
Exponential functions can be used to model real-world problems.
::指数功能可用来模拟现实世界的问题。 -
Exponential functions have parameters that may be used to anticipate behavior.
::指数函数具有可用于预测行为的参数。 -
Simple exponential functions have the structure
-intercept, and
is the multiplier.
::简单指数函数具有 y=a(b)x 结构,其中a 是 y 界面,b 是 乘数。 -
Unlike linear functions, exponential functions do not have a constant rate of change.
::与线性函数不同的是,指数函数没有固定的变动率。
-
Use the table to answer the following questions. After 4 days,
by how much
has the initial value been
multiplied
? After 9 days?