4.4 线性和非线性赤道系统和非线性赤道系统-interactive
章节大纲
-
The Purpose of this Lesson
::本课程的目的In this lesson, you will create and solve linear and non-linear systems algebraically, graphically, and using graphing technology.
::在此教训中, 您将创建和解决线性和非线性系统, 代数、 图形化, 并使用图形化技术 。
Activity 1 : Solving Equations Graphically
::活动1:用图形方式解决Example 1-1
::例1-1An island has a population of deer and antelope. In year 0, the deer have a population of 7. They double every year. In year 0, the antelope number 124. They increase by 51 every year. Here is the central question: Do you think the population of deer exceed that of the antelope? Why?
::一个岛屿有鹿和羚羊的人口。在0年级,鹿有7个人口,每年翻一番。在0年级,羚羊有124个,每年增加51个。这是个中心问题:你以为鹿人口超过羚羊吗?为什么?-
Make a table showing the population of each for several years. Answer the question again.
::绘制一张表格,列出几年来每个人口的情况,再次回答问题。 -
Write an
equation
to model each population as a
function
of the year, state each function's type, and graph them together. Now answer that question again, and estimate when.
::写一个方程, 将每个人口作为年的函数来模拟, 说明每个函数的类型, 并一起绘制图表。 现在再次回答这个问题, 并估计时间 。 -
Write an equation to determine exactly when the population of deer will exceed that of the antelope. This cannot be solved using properties of equ
a
lity and
inverse
operations
. Why not? Solve it using
graphing technology
.
::写入一个方程以确定鹿群将何时超过羚羊群。 这无法用平等和反向操作的特性来解决 。 为什么不呢? 使用图形化技术解决它 。 -
Explain the different methods you used to estimate your solution. About how many deer and antelope will there be when their populations are equal?
::解释您用来估计解决方案的不同方法。 当它们的人口相等时, 将有多少鹿和羚羊?
Solution: Here are the tables for both populations
::解决办法:这是两个人口的表格。
:x) 鹿(y1)07111242283564112522464487896
:The table shows that the population of a ntelope passes that of the deer somewhere between year 5 and year 6.
::该表显示,五至六年级之间,羚羊口通过鹿口。The functions for each are:
::各项职能包括:
::函数TSypey1=7(2)xExplentialy2=51x+124LinearThe graphs of the functions confirm that the population of antelope passes that of the deer between year 5 and year 6.
::函数图证实,羚羊群在5至6年期间通过鹿群。The equation to solve for their intersection is:
::他们交叉路口要解决的方程式是:
::7(2)x=51x+124A few attempts to isolate will show that you do not have the tools to solve this equation algebraically.
::几次试图分离 x 将会显示您没有工具来解析此方程式的代数 。Use the interactive below approximate the point where the line and the curve meet. Consider what the values of the coordinates actually mean. Use the Zoom Out button to find the other point where the functions intersect. Consider why this point exists.
::使用下方的交互式点大致为线和曲线相交点。 考虑坐标的值实际意味着什么。 使用缩放按钮找到函数相交的另一点。 考虑为什么存在此点 。INTERACTIVEApproximate IntersectionClick the checkbox to see the coordinates of the intersection point.
::单击复选框查看交叉点的坐标。Click the "Zoom out" button to look for the other intersection point.
::单击“ 缩小” 按钮以查找其它交叉点 。+Do you want to reset the PLIX?It was possible to predict from the given scenario that the deer would eventually exceed the antelope because always exceeds linear growth. This is because exponential growth functions have an increasing , while have a constant slope. A rough estimate could be gathered from the table. The graph provides an even better picture of the intersection point. Finally, graphing or solving tools can give us precise estimates. Note that you must interpret your results in the context of the problem: Neither deer nor antelope can have a population that isn't an integer!
::从给定的假设情景中可以预测鹿最终会超过羚羊,因为总是超过线性增长。这是因为指数增长函数在增加,同时有一个不变的斜坡。可以从表格中收集粗略估计。图表提供了更清楚的交叉点图。最后,图表或解析工具可以提供准确的估计数。请注意,你必须从问题的角度解释你的结果:无论是鹿还是蚂蚁都不可能有非整数的人口!Solving Equations Graphically
::图形平方解析Equations can represent a relationship between two different functions.
::等式可以代表两种不同职能之间的关系。Solving equations graphically means you want to find the -coordinate of the point of intersection between two functions by solving
::解析方程式图形表示您想要通过解析 f( x) =g( x) 来找到两个函数之间交叉点的 X 坐标 。Given the equation solving it means finding the -value that returns the same -value for both functions.
::根据公式f(x)=g(x),解决它意味着找到两个函数返回相同y值的 x 值。This is visualized as the -value of the point of intersection between the two functions.
::这可视化为两个函数之间交叉点的 x 值 。Sometimes there can be more than one such value, or sometimes no such value.
::有时,这种价值可能不止一个,有时甚至没有这种价值。Work it Out
::工作出来-
Recall that if an object is accelerating at a constant
rate
, its
distance
as a function of time is given by the equation
where
is acceleration. Imagine a car accelerating at
meters per second, per second. Another car is traveling at a constant 57 meters per second.
-
Create functions to model the distance both have traveled as a function of time.
::创建函数以模拟作为时间函数而移动的距离 。 -
Write an equation to determine when one passes the other.
::写一个方程来决定一个通过另一个的方程 。 -
Solve
the equation from part b)
using graphing or solving tools. Determine the distance traveled by each at this time. Are there solutions for
that are not in the practical
domain
for this scenario? Explain.
::使用图形化或解析工具从 b) 部分中解析方程式。 确定当前每个方位的距离。 对于 x, 是否有不属于此方案实用域的解决方案? 解释 。
::回顾如果一个物体以恒定速度加速,它的距离作为时间的函数由等式y=12ax2给出,其中有一个是加速度。想象一辆车加速为每秒23米,每秒23米。另一辆车以每秒57米的恒定速度行驶。另外一辆汽车正在以每秒57米的恒定速度行驶。创建一个函数来模拟两者所穿行的距离。写一个公式来决定一个物体何时通过另一个物体。用图形或解析工具将方程式从 b部分中解析出来。确定此时每个方程式所穿行的距离。对于 x,是否有办法不在实际范围内? 解释 。 -
Create functions to model the distance both have traveled as a function of time.
-
Solve each of the following equations if possible. Otherwise, use technology to approximate the solutions. There may be cases where there is no solution, in which case explain this result in
terms
of either the equation or the graph.
::如果可能的话, 解决以下方程式中的每一个方程式 。 否则, 使用技术来接近解决方案 。 可能会出现没有解决方案的情况, 在这样的情况下, 以方程式或图表来解释这一结果 。
::a.8x2=81b.52x=154c.2x2=3(2)xd.a2+52=72f.5x2=3x+12g.x=5h1x*xxxxxxxxxxx2+2xxxxx2-10
Activity 2: Solving Linear and Non-Linear Systems
::活动2:解决线性和非线性系统和非线性系统Work it Out
::工作出来Half Dome at Yosemite National Park -
Xander and Yana are driving from San Francisco to Yosemite National Park, 180 miles away. Xander drives 40 miles per hour and Yana drives 55 miles per hour. They want to divide the hours equally between the two of them for the drive. Write and solve the
system of equations
that models this scenario. (Hint: If they are driving the same number of hours, what equation can you write?) Represent the system and solution graphically.
::Xander和Yana正在从旧金山开车到180英里外的Yosemite国家公园。 Xander每小时驾驶40英里,Yana每小时驾驶55英里。 他们想要在他们两人之间平均分配驱动器的时数。 写入和解决模拟这个假设的方程式系统 。 (提示:如果他们驾驶相同的时数, 您可以写什么方程式? ) 以图形方式代表系统和解决方案 。 -
Russell is a city planner who wants to build two new roads in the city. The center of the city is at the origin, with the coordinate axes representing two major thoroughfares, one north-south and the other east-west. The new roads will be called Newton's Way and Pascal's Lane. Newton's Way intersects the thoroughfares 15 miles
north of
the city center and a 20 miles west from the city center. Pascal's Lane intersects the thoroughfares 10 miles south of the city center, and 5 miles west of the city center. Create equations that model the scenario, and graph. Determine the
location
of the intersection of the new roads.
::罗素是一个城市规划师,他想在城市建造两条新道路。城市中心位于城市的起点,坐标轴代表两条主要长途,一条南北,另一条东西。新的道路将被称为牛顿路和帕斯卡尔路。牛顿路将城市中心以北15英里、距市中心以西20英里的长途交叉。帕斯卡尔路将城市中心以南10英里处和市中心以西5英里处的长途交叉。创建模拟情景的方程式,并绘制图表。确定新道路的交叉点。 -
Russell wants to build a circular ring road with a radius of 12 miles from the city center, and a new east-west thoroughfare 7 miles north of the city. Find the location of the intersection of the ring road with the new horizontal road. Graph the system and solution.
::Russell想建造一条环环路,半径12英里,离市中心12英里,并建一条新的东西干道,位于市以北7英里。找到环路与新的水平公路交界处的位置。绘制系统和解决方案。 -
Russell wants to build two roads that swing close to the city center. The equation that models the path of these roads is
Are there locations on these roads that are equidistant from the major thoroughfares modeled by the coordinate axes? Write and solve a system to find these points. (Hint: If the distance from the
and
-axes is the same, what equation can you write?)
::Russell 想要建造两条路, 绕近市中心。 模拟这些道路路径的方程式是 Y= 30x。 这些道路上是否有与以坐标轴为模型的主要干道相等的位置? 写入并解决一个查找这些点的系统 。 (提示 : 如果 x 和 y 轴的距离相同, 那么您可以写什么方程式 ?) -
Akira puts $1,200 in an account earning 5% compounded quarterly. When will the initial investment triple? Write an equation to answer this question. Using graphing technology to solve.
::Akira在一个账户中投放1,200美元,每个账户每季收入5 % 。 初始投资将达到3倍? 写一个方程式来回答这个问题。 使用图形化技术来解决问题。 -
A super-villain launches a rocket from 500 meters under the sea at a location modeled by the point
The rocket breaches the surface of the water at the point
A missile is flying along a trajectory modeled by the equation
Write, graph and solve the system to determine where the rocket's path will intersect that of the missile. Does this graph prove that they will encounter each-other? Why or why not? Does this graph account for when the rocket and missile arrive at different locations on their respective paths? Explain. Assume the rocket destroys the missile. The event only shows up on radar if it takes place above 800 meters. Is the event visible on radar?
::一枚超级反政府分子从海上500米处发射一枚火箭,发射地点以点(0,--500)为模型,从海上500米处发射一枚火箭。火箭击中点(700,0)的水面。一枚导弹正沿着6x+4y=900的方程式模拟的轨道飞行。写、图形和解析系统以确定火箭的路径与导弹的路径相交叉。这个图是否证明它们会彼此相遇?为什么或为什么不?这个图是否说明了火箭和导弹到达各自路径的不同位置?解释。假设火箭摧毁导弹,只有在超过800米时才会在雷达上显示。事件是否在雷达上可见?
Example 2-1
::例2-1Caroline is a trick shot expert who wants to drop a baseball from an 1167 meter cliff, into a bucket below. A camera-drone ascends from the ground at 52 meters per second at the instant the baseball is dropped. To determine the height at which the drone passes the baseball, solve the system with graphing technology. Is the graph a "side-view" of the scenario, where the distance along the -axis represents physical distance from the cliff in the scenario? Why or why not?
::Caroline是一位魔术射击专家,他想把棒球从1167米悬崖上扔到下面的桶里。 棒球落地时,一个摄像床从地面上升52米/秒。 为了确定无人驾驶飞机通过棒球的高度,用图形技术解决系统问题。 图表是场场景的“侧景 ” , 在情景中, X轴的距离代表着悬崖的距离。 为什么或为什么没有?Solution: The equation for the distance a dropped object falls is where is acceleration due to gravity, and and are the initial velocity and initial height. Neglecting air resistance, acceleration due to gravity is about -9.8 meters per second per second. There is no initial velocity because the object is dropped, not thrown upwards or downwards. There is an initial height of 1167:
::解析度: 被丢弃物体坠落距离的方程式是 h( x) = 12ax2+v0x+h0. 其中, 一种因重力加速, v0 和 h0 是初始速度和初始高度。 忽略空气阻力, 重力加速为每秒- 9.8米/秒。 没有初始速度, 因为物体被丢弃, 没有向上或向下投掷。 初始高度为 1167 :
::h(x) 4. 9x2+1167The drones height as a function of time is given by:
::无人驾驶飞机高度作为时间函数由下列因素决定:
::d(x)=52xTo determine the time that the drone has the same height as the baseball:
::确定无人机身高与棒球身高相同的时间:
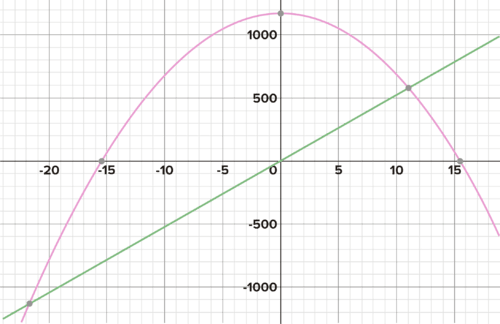
::-4.9x2+1167=52xYou do not yet have the tools to solve this algebraically. Solving the system graphically approximately yields:
::您还没有解决此代数的工具。 以图形方式解析系统大约的产量 :Note in the graph that there are two solutions. Only the solution with a positive output makes sense.
::图表中注意有两种解决方案。 只有正输出的解决方案才有意义 。Caroline is a trick shot expert who wants to drop a basketball from a cliff into a bucket. Interactive
::交互式互动Explore the above scenario more with the interactive below.
::更深入地探讨上述设想方案,与下文互动。INTERACTIVETrick Shot Expert!Click the buttons to graph the functions that model the falling baseball and the flying drone.
::单击按钮来绘制模型的函数, 以模拟棒球和无人驾驶飞行器的下降。-
After the trick shot animation finishes, drag the slider located in the x-axis to change time.
::戏法拍摄动画完成后, 拖动位于 X 轴中的滑动器以更改时间 。 -
The baseball hits the ground
≈ 15.4 seconds
::棒球打到地面15.4秒
+Do you want to reset the PLIX?
Activity 3 : Solving Polynomial Equations
::活动3:解决多面等同Work it Out
::工作出来-
Maya
uses a catapult to launch
a baseball straight up, with a positive initial velocity of 70 meters per second. Neglecting air resistance, create a function which models the height of the baseball as a function of time. Use graphing technology to determine when the baseball reaches the
200
meter mark. Use graphing technology to estimate when the baseball reaches its maximum height, and when it hits the ground. Is there a relationship between the time the baseball was launched, the time it hits the ground, and the time it reaches its maximum height? Explain. What type of function is this? What is the point representing it's maximum height called?
::玛雅使用弹片直直地发射棒球, 初始速度为每秒70米。 忽略空气阻力, 创建一个函数, 将棒球的高度作为时间函数来模拟。 使用图形化技术来决定棒球何时达到200米标记。 使用图形化技术来估计棒球何时达到最大高度, 以及何时到达地面。 棒球发射时、 何时击中地面、 何时到达地面, 以及何时达到最高高度之间是否有某种关系 ? 解释这是哪种函数? 代表棒球最大高度的点是什么? -
Solve the following system algebraically. Interpret the result. Confirm your results graphically.
::以图形方式确认您的计算结果 。
::y= 5x3+4x2+3x2+2y=5x3+4x2+3xx-
Solve the following system algebraically. Interpret the result. Confirm your results graphically.
::以图形方式确认您的计算结果 。
::3x+4y2=9x=3-43y2-
The path of a section of a rollercoaster is given by the first equation below. The coordinate axes represents the horizontal and
vertical
distance travelled. The path of a camera which travels along a track to record the riders is given by the second equation. Both equations have a domain restricted to
Use graphing technology to graph both functions and find the points where riders must smile for the camera. Estimate the maximum height and minimum height reached over the given domain.
::下面第一个方程式给出了滚滚车部分的路径。 坐标轴代表水平和垂直的距离。 第二个方程式给出了沿轨记录骑手的相机路径。 两个方程式的域限为 [10,100] 。 使用图形化技术绘制两个函数, 并找到骑手必须微笑相机的点 。 估计特定域的最大高度和最小高度 。
::y=0.001 (x- 10) (x- 50) (x- 100)+50y @ @ 12x+80)Interactive
::交互式互动Use the interactive below to change the parameters of the given quadratic functions and create different systems. Create a system that has 2 solutions, and record the equations for the system. Create a system with 1 solution, and record the equations. Create a system with 0 solutions, and record the equations. Under what conditions does the system have 2, 1 or 0 solutions? Explain.
::使用下面的交互功能来改变给定的二次函数参数并创建不同的系统。 创建一个有两个解决方案的系统, 并记录系统的方程式。 创建一个有1解决方案的系统, 并记录方程式。 创建一个有0解决方案的系统, 并记录方程式。 在什么条件下系统有 2, 1 或 0 解决方案? 解释 。INTERACTIVESolving Linear and Non-Linear SystemsMove the red and blue points to change the shapes of the graphed quadratic functions. Notice that the intersections are solutions to this system of equations.
::移动红点和蓝色点以改变图形化二次函数的形状。请注意,交叉点是此方程系统的解决办法。+Do you want to reset the PLIX?Summary
::摘要-
The solution to a system of equations is the set of points that make both equations true.
::方程体系的解决方案是将两种方程都变为真实的一组点。 -
It is represented by the intersection point(s) of the graphs of the two equations.
::它由两个方程式的图形的交叉点表示。 -
Systems can be solved algebraically or graphically.
::系统可以用代数或图形解析。 -
Systems can have any number of solutions, including no solution.
::各个系统可以有各种解决办法,包括没有解决办法。
-
Make a table showing the population of each for several years. Answer the question again.