10.3直方图-interactive
章节大纲
-
How Do You Travel?
::你旅行怎么样?How could you organize and display the different ways that you and your friends travel to and from school – on foot, by bicycle, by bus, by car, and so on – to find out which method is used by the most students?
::如何组织和展示你和你朋友往返学校的不同方式 — — 步行、自行车、公共汽车、汽车等 — — 找出大多数学生使用的方法?Use the interactive below to compare three types of data displays: Data Table, Bar Chart and Dot Plot .
::使用以下互动方式比较三种类型的数据显示:数据表、条形图和点图。INTERACTIVEHow Do You Travel?-
Click the buttons to see different ways to visualize data.
::单击按钮可看到不同方式的可视化数据。
+Do you want to reset the PLIX?Progress0 / 11.Which type(s) of representation(s) demonstrated in the interactive do you think is best to "organize and display the different ways that you and your friends travel to and from school to find out which method is used by the most students?"
::你认为互动中展示哪类(或几类)代表是否最适合“组织和展示你和你的朋友往返学校以找出大多数学生使用哪种方法的不同方式?”Be sure to answer in sentences, and think through your response before typing it in.
::一定要在句子里回答, 在输入前先考虑一下你的反应。Maximum 1000 characters (1000 Remaining)A frequency table lists items together according to the number of times, or frequency , that the items occur. Here is an example of a frequency table:
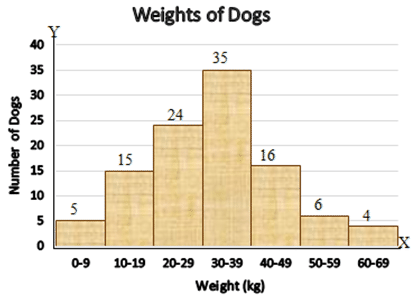
::频率表根据项目发生的次数或频率,将项目一起列出。此为频率表的一个示例:Weights of Dogs (kg)
::狗体重(公斤)Interval Frequency 0-9 5 10-19 15 20-29 24 30-39 35 40-49 16 50-59 6 60-69 4 A histogram is a type of frequency plot whose bars represent the frequencies of numeric data within equal intervals (e.g. 1-5, 6-10, 11-15). It also gives a picture of the distribution of a data set by grouping data in intervals. See an example below. Notice that the histogram shows frequencies on the vertical axis and the intervals on the horizontal axis.
::直方图是一种频率图,其条形图代表数字数据在相等间隔内的频率(例如1-5、6-10、11-15),它还通过间距对数据组进行分组来显示数据集的分布情况。见下面的例子。注意直方图显示垂直轴上的频率和水平轴上的间隔。
High School Basketball
::高中篮球The members of the high-school basketball team practice taking free throws. Each player attempts 50 free throws. The number of free throws made by each player is listed below.
::高中篮球队成员免费投球,每个球员尝试50次。下面列出每个球员免费投球的次数。{25, 29, 29, 30, 33, 34, 35, 35, 36, 39, 42, 44}
In this interactive, create a dot plot using the high-school basketball team’s free-throw data above.
::利用高中篮球队的免费发射数据, 建立点图。INTERACTIVENumber of Free Throws MadeDrag the dots to the correct location to create a dot plot using the following data:
::将点拖到正确位置, 以便使用以下数据创建点图 :{25, 29, 29, 30, 33, 34, 35, 35, 36, 39, 42, 44}
+Do you want to reset the PLIX?
Who Let the Dogs Out?!
::谁让狗队出来?A dog walker counts and records the number of dogs at a dog park every morning at 8:00am for several days.
::每天早上8: 00,Here is the data that was collected: { 8, 2, 5, 6, 3, 4, 7, 4, 5, 3, 4, 7, 3, 1, 6, 4, 3, 2, 5, 8}
::以下是所收集的数据:{8,2,5,6,6,3,4,7,4,5,3,4,5,4,3,7,3,3,1,6,4,3,3,3,3,2,5,8}Use this data to answer the questions .
::使用此数据回答问题 。After completing the questions above, click Review Your Answers to see the frequency table you created. Use the frequency table in the following interactive to make a histogram that also represents the data.
::在完成上述问题后,单击“审查您的答复”以查看您创建的频率表。使用以下交互式的频率表来绘制一个直方图,该直方图也代表数据。INTERACTIVENumber of Dogs at a Dog Park Every Morning-
Create a histogram that corresponds to the table you created above.
::创建直方图, 该直方图与您在上面创建的表格相对应 。 -
Drag each point to change the frequency for each interval.
::拖曳每个点以改变每个间隔的频率。
+Do you want to reset the PLIX?
How Many Teenagers at This School?
::这所学校有多少青少年?Complete the activity and follow-up questions on this interactive PLIX:
::完成关于此交互式PLIX的活动和后续问题:
Challenge Question!
::挑战问题!For a month, Maniyah counted and recorded the number of cars that drove by the school during her lunch hour: {19, 3, 9, 11, 12, 13, 15, 17, 7, 14, 9, 12, 13, 16, 4, 8, 11, 12, 19, 12}.
::在一个月的时间里,Maniyah计算并记录了午餐时经学校驾驶的汽车数量:{19,3,9,11,12,13,15,17,7,14,9,12,13,16,4,8,11,12,19,12}。In the interactive below, create a histogram based on Maniyah’s data of counted cars during her lunch hours. What does the shape of the histogram tell you about the situation?
::在下文的互动中,根据Maniyah午餐时段的计数汽车数据创建直方图。 直方图的形状能告诉你什么情况?INTERACTIVECounting CarsThe numbers of cars Maniyah saw during her lunch hours for a month are 19, 3, 9, 11, 12, 13, 15, 17, 7, 14, 9, 12, 13, 16, 4, 8, 11, 12, 19, 12.
::曼尼耶赫在午餐时间看到一个月的汽车数量是19、3、9、11、12、13、15、17、7、14、9、12、13、16、4、8、11、12、19、12、12。-
Drag the four red dots to create a histogram for this data.
::拖曳四个红色点,为此数据创建直方图。 -
Press the "Check" button to check your answer.
::按“ 检查” 按钮检查您的回答 。
+Do you want to reset the PLIX?Discussion Questions
::讨论问题 讨论问题-
Why is it important to use a frequency table to organize the data?
::为什么使用频率表来组织数据很重要? -
How do you choose intervals for a histogram? Why is this important?
::你如何选择直方图的间隔? 为什么这很重要?
Summary
::摘要Histogram - a visual representation of a data set.
::直方图 -- -- 一组数据集的直观表示。-
Shows the frequency of data points within a given data set.
::在给定的数据集中显示数据点的频率。 -
The data set is divided into equal intervals.
::数据集按相等间隔分列。 -
Each bar represents the frequency of data within the interval.
::每个栏代表间隔内的数据频率。
-
Click the buttons to see different ways to visualize data.