10.8 绘图盒-interactive
章节大纲
-
Roll it Back
::滚回滚回滚回滚回滚回滚回滚回滚回滚回滚回滚回滚回滚回滚回滚回滚Practice finding the medians of a data set and parts of a data set using the interactive below.
::做法是利用以下互动手段找到数据集和数据集部分的中位数。INTERACTIVEFinding Medians-
Find the median of the data set.
::查找数据集的中位数。 -
Next, find the upper quartile and lower quartile.
::接下来,找到上四分位和下四分位。
+Do you want to reset the PLIX?Progress0 / 31.Look at the new data set again.
::再看看新的数据集。@$\begin{align*}\left\{3,4,5,6,7,8,9,10,11,12\right\}\end{align*}@$
::@ $\ begin{ left} 3, 5, 5, 5, 7, 8, 9, 10, 11, 12\ right} end{ left} 3, 5, 6, 7, 8, 9, 9, 10, 11, 12\ right} end{ leavign} $Select the true statements.
::选择真实语句。Select all that applyaThe lower half of the data is @$\begin{align*}\left\{3,4,5,6,7\right\}.\end{align*}@$
::数据下半部分是 @$\ begin{ left} 3、 5、 6、 7\ right}.\ end{ align} $bThe upper half of the data is @$\begin{align*}\left\{9,10,11,12\right\}.\end{align*}@$
::数据上半部是 @$\ begin{ left}\\\ 9, 10, 11, 12\right\\\.\end{ align}$cThe lower half of the data is @$\begin{align*}\left\{3,4,5,6,\right\}.\end{align*}@$
::数据下半部分是 @$\ begin{ left} 3、 5、 6、\ right}.\ end{ align} $dThe upper half of the data is @$\begin{align*}\left\{8,9,10,11,12\right\}\end{align*}@$ .
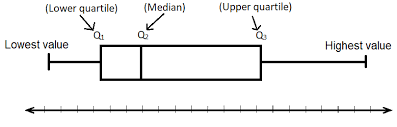
::数据上半部是 @$\ begin{ align} left\\\\ 8, 9, 10, 11, 12\ right\end{ align}$。A box plot is a visual display that shows how values in a data set are distributed. To make a box plot, first find the five number summary for the data set:
::框图是一个显示数据集中值如何分布的视觉显示。要绘制框图,首先要找到数据集的五个数字摘要:1) the minimum – the least value
:1) 最低值 - 最低值
2) the lower quartile – the middle of the lower half of the data .
::2) 下四分位数 - - - 数据下半部分的中间部分。3) the – the middle of the data set
::3) - 数据集的中间部分4) the upper quartile – the middle of the upper half of the data
::4) 上四分位数 - 数据上半部的中间5) the maximum – the greatest value
:Box plots are sometimes called box-and-whisker plots. The box shows the lower quartile, the median, and the upper quartile, and the "whiskers" are drawn from the box to the minimum and maximum values.
::框图有时被称为箱式和口语图。 框图显示下四分位、 中位数和上四分位数, “ 口语”则从框图中抽出到最小值和最大值。See the image below for an example of a box plot :
::框图的示例请见下文的图像 :The upper half of the data is considered all values above the median. The lower half of the data is considered all values below the median.
::数据上半部为中位数以上的所有值,下半部为中位数以下的所有值。Example
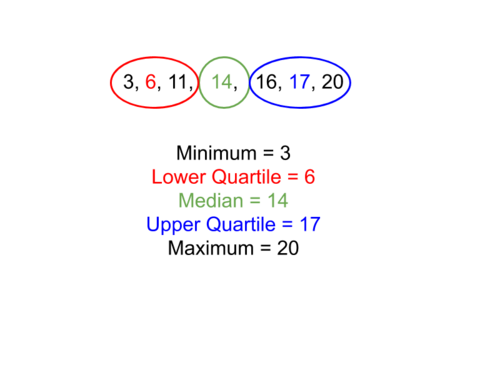
::示例示例示例示例Find the five number summary for the data set: {3, 6, 11, 14, 16, 17, 20}
::查找数据集的五个数字摘要:{3,6,11,14,16,17,20}Example
::示例示例示例示例Find the five number summary for the data set {3, 6, 9, 10, 14, 16, 18, 20, 22, 25}
::查找数据集的五个数字摘要{3,6,9,10,14,16,18,20,22,25}The interquartile range , or IQR, is the range between the upper and lower quartiles. In other words, you find the difference between the upper quartile and the lower quartile. For example: 76 (upper quartile) - 59 (lower quartile) = 17 (IQR).
::孔径范围, 即 IQR , 是上角和下角四分位之间的范围。 换句话说, 您会发现上角四分位和下角四分位之间的差别。 例如: 76( 上四分位) - 59( 下角四分位) = 17( IQR ) 。A measure of variability (or measure of spread ) is a single number that describes the spread of a data set, such as the interquartile range (IQR).
::可变性度量(或扩散度度)是一个单一数字,表示数据集的分布,如孔径范围(IQR)。The range is the difference of the greatest value and the least value in a set of data.
::范围是一组数据中最大值和最低值的差异。
Books Read by Your School
::您学校阅读的书籍# of Books Read by Classes 23 13 20 32 18 27 35 22 15 Order the data and find the five number summary from the data set to create a box plot.
::排序数据,并从数据集中找到五个数字摘要,以创建框图。In the interactive below, construct a box and whisker plot using the data above.
::在下文互动部分,利用上述数据构建一个盒子和长方形图。INTERACTIVEBox and Whisker Plot-
Drag the red points to construct a box plot based on the data.
::拖曳红色点以根据数据构建框图 。 -
Drag the numbers at the bottom to help you find the median, minimum, maximum, and quartiles.
::拖动底部的数字,帮助您找到中位数、最小数、最大数和四分位数。
+Do you want to reset the PLIX?Discussion Question
::讨论问题Clara claims that if the distance from the minimum to the median is greater than the distance from the median to the maximum, the data is more spread out on the left of the mean. Do you agree? What additional information could support her claim?
::Clara声称,如果从最低到中位数的距离大于从中位数到中位数的距离,则数据在中位数左边分布得更多。您同意吗?哪些补充资料可以支持她的主张?
What the Height?!!
::什么高度? ! ! ! ! !Use the interactive below to rearrange people from shortest to tallest, find the median of those heights as well as find the medians of the upper and lower quartiles. Afterwards you will construct a box and whisker plot based on those heights.
::使用下面的互动将人们从最短的高度重新排列到最高, 找到这些高度的中位数, 并找到上角和下角的中位数。 然后根据这些高度建一个盒子和长角图 。INTERACTIVEWhat the Height?-
Drag the people to rearrange them from least to greatest
::拖拉人们的拖拉,以便他们从最起码地重新排列到最伟大的 -
Input the correct answers, then click "Next"
::输入正确的答案,然后单击“下一个” -
Move the dots to make the correct box and whisker plot
::移动点以做出正确的框和hossker 绘图
+Do you want to reset the PLIX?
Puppy Weights!
::狗狗的重量!Puppies! Below are the 25 birth weights, in ounces, of all the Labrador Retriever puppies born at Kensington Kennels in the last six months.
::以下是过去六个月在肯辛顿肯内尔斯出生的所有拉布拉多再生小狗的25个出生体重,以盎司计。1) Determine the median of the data set.
:2) Determine the minimum and maximum values of the data set.
:3) Determine the lower quartile.
:4) Determine the upper quartile.
:5) Now you can use the interactive below to help construct a box plot of the data and answer the questions.
:In the interactive below, construct a box and whisker plot using the data above. Correctly place the median of the upper and lower quartiles as well as the median of the overall data set.
::在下文互动部分,使用以上数据构建一个框和刻度图,正确定位上下四角形的中位数以及总体数据集的中位数。INTERACTIVEPuppy Weights-
Drag the red points to construct a box plot based on the data below.
::拖曳红色点以根据下面的数据构建一个框图 。
+Do you want to reset the PLIX?Discussion Question
::讨论问题The mean of the dataset is 16.92 ounces and the mean absolute deviation is approximately 1.15 ounces. Which set of statistics do you feel better describes the data: the median and the interquartile range, or the mean and the mean absolute deviation (MAD)? Why?
::数据集的平均值是16.92盎司,而平均绝对偏差约为1.15盎司。你认为哪组统计数据更能描述数据:中位数和间距,还是中位数和平均绝对偏差(MAD)?为什么?Summary
::摘要Box plot = box-and-whisker plot
::框图 = 箱式和口述图A box plot is another way to display the spread of data by looking at the range and IQR
::框图是另一种通过查看范围与 IQR 来显示数据扩散的方式You need to find the five number summary to create a box plot:
::您需要找到五个数字摘要来创建框图 :-
minimum
::最低 -
lower quartile
::下四面体 -
median
::中中中 -
upper quartile
::上四面体 -
maximum
::最大
-
Find the median of the data set.