10.9 使用盒式图案-interactive
章节大纲
-
Reviewing Box Plots
::复览框绘图Use the interactive below to identify parts of a box plot and how the shape of it changes with different samples.
::使用下面的交互式图解来识别盒子图块的部分,以及用不同的样本来识别其形状如何变化。INTERACTIVEIdentifying Components Of A Box Plot-
Click the red lines that correspond with different values of the box plot.
::单击与框图的不同值相对应的红线。 -
After all the values have been selected, press the button to look at different samples of data.
::在所有值被选中后, 按下按钮查看不同的数据样本 。
+Do you want to reset the PLIX?Progress0 / 31.From the given plot, find the lower quartile and the upper quartile.

::从给定的地块中找到下四分位数和上四分位数。a5 ; 18
b8 ; 14
c5 ; 14
d8 ; 18
Discussion Question
::讨论问题Is it possible for multiple critical values to have equal values? For example can the equal the upper quartile ? How? Does this only happen when all values in the set are the same?
::多重关键值是否可能具有等值 ? 例如, 等值的上四角形会否 ? 如何? 这是否只有在集中的所有值都相同时才发生 ?
Double Box Plots
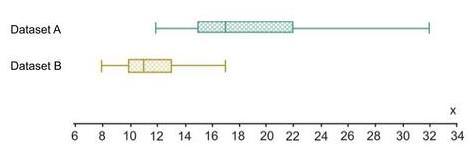
::双框图You can put multiple box plots over the same number line to help visualize and compare data representing different groups. The double box plot below represents two datasets: dataset A and dataset B.
::您可以在同一数字行上放置多个框块, 帮助可视化和比较代表不同组的数据。 下面的双框块显示两个数据集: 数据集 A 和 数据集 B 。A double box plot Looking at the two datasets, you can see that Dataset A has a greater median than Dataset b. Additionally, you can see that Dataset A has a greater spread than Dataset B.
::查看这两个数据集,你可以看到数据集A的中位数大于数据集b。此外,你可以看到数据集A的传播范围大于数据集B。You can also make observations using the quartiles. For example, the top 50% of Dataset A occurs above the maximum value of Dataset B.
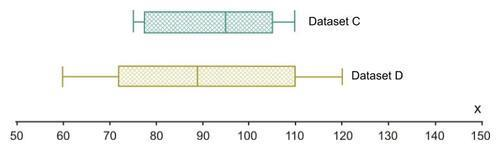
::您也可以使用四分位数进行观测。例如,数据集A的顶部50%发生于数据集B的最大值之上。Use the double box plot below to answer the questions in the interactive.
::使用下面的双倍框图解答互动中的问题。Another double box plot Discussion Question
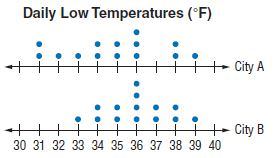
::讨论问题The image below displays a double dot plot . What are the potential benefits of using a double box plot over a double dot plot? What are the potential benefits of using a double dot plot over a double box plot?
::下面的图像显示双点图案。 在双点图案上使用双点图案的潜在好处是什么? 在双点图案上使用双点图案的潜在好处是什么? 在双点图案上使用双点图案的潜在好处是什么?A Double Dot Plot
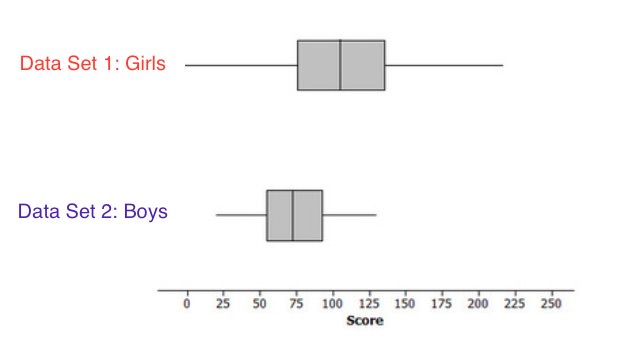
Video Game Scores
::视频游戏评分Data Set 1 consists of data on the scores on a video game for 100 teenage girls. Data Set 2 consists of scores on a video game for 100 teenage boys. Box plots of the two data sets are shown below:
::数据集1包括100名少女在视频游戏中得分的数据;数据集2包括100名少年男孩在视频游戏中得分的数据。Discussion Questions
::讨论问题 讨论问题-
What do the median and
interquartile range
tell you about the boys' and girls' scores respectively?
::中位数和内分数范围 分别告诉你男女分数多少? -
What would the mean and
mean absolute deviation
look like and would they give us a different perspective on the data?
::绝对偏差的含义和含义是什么? 它们是否会使我们对数据有不同的看法?
Comparing Test Scores in Mr. Sanchez's Class
::比较桑切斯先生班级的考试分数In Mr. Sanchez's math classroom, more people sit on the right-hand side of the room than the left side.
::在桑切斯先生的数学教室里,坐在房间右侧的人比坐在左边的人多。The students on the right-hand side of the classroom received the following scores on an exam worth 100 points:
::教室右侧的学生在一次100分的考试中得分如下:[85, 90, 100, 95, 0, 0, 90, 70, 100, 95, 80, 95]
The students on the left-hand side received these test scores:
::左手边的学生获得了这些考试分数:[65, 80, 90, 65, 80, 60, 95, 85]
In the interactive below, construct two box plots based on the two data sets above: students on the right-hand side of the classroom and students on the left-hand side of the classroom. Compare the components of the box plots together.
::在下文互动部分,根据以上两套数据构建两盒地块:教室右侧的学生和教室左侧的学生。将盒子地块的各个组成部分放在一起比较。INTERACTIVEComparing Test Scores in Mr. Sanchez's ClassDrag the red dots to adjust the box plots so that they match the data provided.
::拖曳红色点以调整框块图,使其与所提供的数据匹配。+Do you want to reset the PLIX?Discussion Question
::讨论问题Which side of the room do you feel did better? Is there any information that you don't have but would support your argument?
::你觉得房间的哪一边比较好?你有什么信息,你除了支持你的论点之外,没有其它信息吗?Summary
::摘要Statistics is a powerful tool for supporting arguments in a variety of contexts -- education, sports, medicine, science, business, etc. There are usually always choices to be made, and which statistics to use and how, can be helpful in making those decisions. -
Click the red lines that correspond with different values of the box plot.