3.6 与二次函数建模-interactive
章节大纲
-
Learning Objectives
::学习目标-
Solve real-world problems by writing a
quadratic function
.
::通过写出二次函数来解决现实世界的问题。 -
Fit a nonlinear
function
to a scatter plot.
::非线性函数适合散射图 。 -
Find the
equation
of a quadratic given the graph.
::查找图形给出的二次方程。 -
Identify the graph of a quadratic function given the equation.
::根据方程式指定二次函数的图形。
Introduction: Making Connections
::导言:连接Graph theory is a branch of mathematics that studies relationships between objects. Graph theory is used to make connections between molecules in life-saving medicines, to layout transportation systems, and much more. In this lesson , you will apply your knowledge of quadratic equations to model the connections between various objects.
::图形理论是数学的一个分支, 研究对象之间的关系。 图形理论被用于在挽救生命的药物中的分子之间建立联系, 与布局运输系统的联系, 以及更多。 在此课程中, 您将应用您对二次方程的知识来模拟不同对象之间的联系 。Example
::示例示例示例示例A lacrosse league has 8 teams. How many total games will need to be played on the schedule so that every team in the league plays each team exactly once?
::曲棍球联盟有8个球队。在时间表上需要玩多少场比赛才能让联盟的每个球队一一出球?
Activity 1: Modeling W ith Quadratic Functions
::活动1:以二次函数建模To answer the question from the introduction, you will need to be able to write a quadratic function to represent data. Standard form, vertex form, and factored form can be used to write a quadratic model. T he example below uses standard form to write a quadratic model.
::要回答引言中的问题, 您需要能够写入一个二次函数来代表数据。 标准窗体、 顶点窗体和因子窗体可以用于写入二次模型。 下面的示例使用标准格式来写二次模型 。Example
::示例示例示例示例A farmer is setting up a rectangular pigpen. He bought 100 feet of fence with the plan to construct the pigpen so that one side runs along the already existing fence. Write a function that will allow you to find the area of a plot of land as a function of the width given the fencing restriction. What is the maximum possible area for the plot of land?
::农民正在建立一个长方形猪棚,他购买了100英尺长的栅栏,并计划建造这根猪棚,这样一面沿着已经存在的栅栏运行。写一个功能,使你能够找到一块土地的面积,根据栅栏限制的宽度来计算。T he area of a rectangle can be found using the formula but this equation involves three variables. By writing the length in terms of the width, the equation can be represented using two variables.
::矩形区域使用公式“区域=长半径”可以找到,但此方程式包含三个变量。用宽度写出长度,方程式可以用两个变量表示。The p erimeter of a rectangle is usually found using the formula In this case, since the farmer only needs three sides, use T he perimeter is 100 feet so you can substitute this into the perimeter formula :
::矩形的周界通常使用公式P=2l+2w。 在这种情况下,由于农民只需要三面,使用P=2w+l。 周界为100英尺,您可以将其替换成周界公式:100=2w+l。Next, solve for the length and substitute it into the rectangle area formula : which can be simplified and written in as
::下一步,解决长度问题,将其替换成矩形区域公式:区域=(100-2w)w,可以简化并写成 f(w)2w2+100w。
Activity 2: Fitting a Quadratic Function to Scatter Plot Data
::活动2: 将“二次曲线函数”适合散放绘图数据Models are an effective way to infer relationships from data. When bivariate data tends to rise and fall or vice versa, a quadratic regression model may be appropriate. Using what you know about the forms of quadratic functions, you can create a model to best fit the data.
::模型是从数据中推断关系的有效方法。 当双轨数据往往上升和下降, 或者相反, 二次回归模型可能是合适的。 使用您对二次函数形式的了解, 您可以创建一个最适合数据的模型 。Example
::示例示例示例示例A restaurant chain plans to add a new item to its menu. However, the restaurant is still undecided on the price of the new item. The new item is introduced at randomly selected locations. Additionally, each location sells the item at a randomly selected price. The monthly revenue from each location is displayed below. Use this data to create a model for the revenue as a function of price.
::餐饮连锁店计划在其菜单中添加一个新项目。 但是, 餐厅尚未决定新项目的价格。 新项目是在随机选定的地点推出的。 此外, 每个地点都以随机选定的价格出售该项目。 下面显示每个地点的月收入。 使用此数据来创建收入模式作为价格的函数 。Use the dropdown to select a form to enter the function values. As you enter values into the function in the interactive, the graph of the function you describe will appear in red. The numbers you enter will stay black until you enter the correct values to match the quadratic of best fit, then they will change to green.
::使用下拉键选择一个表格以输入函数值。当您在互动函数中输入值时,您描述的函数图形将以红色显示。输入的数字将保持黑色,直到您输入正确值以匹配最适合的二次曲线,然后它们将变为绿色。Discussion Question : Which quadratic function form did you use and why? When is one form more useful than another?
::讨论问题:你使用哪种二次函数形式以及为什么?一种形式什么时候比另一种形式更有用?
Activity 3: Making Connections Continued
::活动3:继续连接Recall the question from the introduction:
::回顾导言中的问题:A lacrosse league has 8 teams. How many total games will need to be played on the schedule so that every team in the league plays each team exactly once?
::曲棍球联盟有8个球队。在时间表上需要玩多少场比赛才能让联盟的每个球队一一出球?Counting this out would take a long time and could be difficult to keep track of. A faster way to do this would be to generalize a rule by looking at smaller numbers of teams first and then applying it to the case of 8 teams:
::计算这一点需要很长的时间,而且可能难以追踪。 更快的方法就是先考虑人数较少的小组,然后将规则适用于8个小组,从而普遍化规则:How many total games will need to be played on the schedule so that every team in the league plays each team exactly once if there were 2 teams? What about 3 teams?
::时间表上需要玩多少场游戏才能让联盟的每个球队在有2个球队的情况下,一队一队一队地比赛?After gathering enough data points, you can see that the relationship between the number of teams and the number of games is quadratic.
::在收集足够多的数据点后,你可以看到团队数量和游戏数量之间的关系是二次的。There are many strategies for writing a quadratic function given some number of points. The approach will vary based on what information you are given.
::存在许多写作二次函数的战略, 给出了一定的点。 方法会根据您所提供的信息而有所不同 。Example
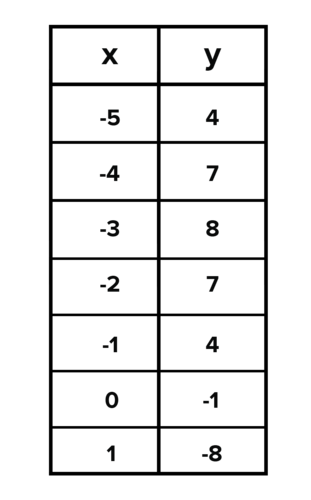
::示例示例示例示例Write a function to model the points listed in the table below:
::写入函数以模拟下表所列点:If you know one of the coefficients or in standard form you can use two points to set up a system of two equations to find the remaining coefficients.
::如果您知道标准格式f(x)=ax2+bx+c中的一种系数(a、b或c),可以使用两个点来建立由两个方程式组成的系统,找到剩余系数。In this case, the y-intercept is given, which means that the - coefficient is -1.
::在这种情况下,即给出了Y的截取,(0,-1),这意味着c-convaly是-1。You can plug into standard form:
::您可以将 c% 1 插入标准窗体 :
::f(x) = 轴2+bx- 1U se the points (-2, 7) and (-1, 4) to set up and solve a system of equations to find and S ubstitute the -coordinate of the points in for and the -coordinate of the points in for
::使用点(2、2、7)和(-1、4)来建立和解决一个方程系统以查找 a和 b。 替换 x 和 f(x) 的 x 坐标点的 x 坐标点和 f(x) 的 y 坐标点 。
:7)(-2-2)2+b(-2)-7=4a-2b-1(4)=a(-1)2+b(-1)-1-1-4=a-b-1
Moving the -1 to the left side in both equations will result in the following:
::在两个方程中将 -1 移动到左边的左侧将产生以下结果:
::8=4a-2b5=a-bThis system of equations can be solved by graphing, substitution, or elimination.
::这一方程式系统可以通过图形化、替代或消除来解决。Using substitution, solve the second equation for getting and substitute it into the first equation for Once you find plug it back into to find
::使用替换, 解析 a 的第二个方程式, 获取 a= 5+b, 并将其替换为 a 的第一个方程式。 一旦找到 b, 将它插入 a= 5+b 中以找到 a 。
::8=4(5+b)-2b8=20+4b-2b8=20+2b-20-20-12=2b=2b=2222_2-6=巴=5+巴=5+5+(6)a_1Now that you found and you can write the function.
::现在您找到了 a++1,b++6 和 c++1, 您可以写入此函数 。
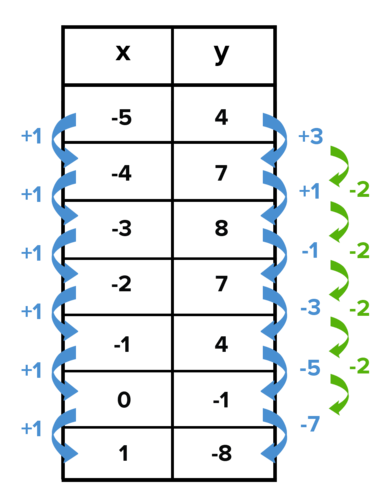
::答复:f(x)x2-6x-1Another way to find the function from a table would be to use the fact that the -coefficient will always equal half the second difference . U se the table to find the second difference of the function:
::从表格中找到函数的另一种方式是使用一个系数总等于第二个差数的一半这一事实。 使用表格查找函数的第二个差数 :T he second difference is -2, so t he -coefficient will be half that value: -1. Then substitute one of the points, along with the - and -coefficients into the function, so you can solve for
::第二个差数是 - 2, 所以系数值为 : - 1 。 然后将一个点替换为函数的系数和系数, 这样您就可以解决 b 。You could also find using the formula for the vertex since you know from the table that the vertex is at
::您也可以使用顶点公式 xb2a 找到 b, 因为您从表格中知道顶点在 (- 3, 8) :
::xb2a-3b2(-1)-6=bAnother approach to writing the function could have been substituting the -coefficient and the vertex into the vertex form, to write the equation.
::写入函数的另一种方法可能是将一个系数和顶点替换为顶点形式f(x)=a(x-h)2+k,以写入方程式。
:Answer the questions below to write a quadratic function to model the problem in the introduction.
::回答下列问题,以写出一个二次函数,作为导言中问题的模型。Discussion Question : You were able to find the function in factored form using an intercept of ( 1, 0 ), the stretch factor of and another point. C ould you have derived the function using the standard form? How? Would this have been easier or harder?
::讨论问题:您能够使用 X 的截取器(1, 0) 、 12 的伸缩因数和另一个点来找到该函数。 您能否用标准表来得出该函数? 如何? 这是更容易还是更难 ?Use the interactive below to practice writing quadratic functions given different pieces of information.
::根据不同的信息,使用下面的交互功能来练习刻写二次函数。
Activity 4: Calculating the Bounce
::活动4:计算弹跳Function models are incredibly useful, but they only model what takes place within the domain . Sometimes piecewise functions are needed to expand the domain of a model because the relationship between variables may change at a certain point.
::函数模型非常有用, 但是它们只是模拟在域内发生的事情。 有时需要小字函数来扩展模型的域, 因为变量之间的关系会在某个时刻发生变化 。Example
::示例示例示例示例When a tennis ball is dropped, it will bounce to approximately 50% of the height it fell from. The height, in feet, as a function of time, in seconds, once the ball is dropped can be modeled by the function The maximum height is 64 feet and will change after each bounce. The -16 comes from half the acceleration due to gravity, which will not change as the ball bounces.
::当网球被投下时,它会弹到大约50%的高度,从它掉下来。高度,以脚为单位,以时间函数,以秒为单位,一旦投下球,就可以用函数 h(t)\\\\\16t2+64模拟。最大高度为64英尺,每次弹出后会变化。 - 16来自因重力而加速度的一半,但不会随着球弹出而变化。-
Write a piecewise function to represent the height of the tennis ball, as a function of time, while it falls to the ground and then for each bounce afterwards.
::写成一个小字函数以代表网球的高度, 作为时间的函数, 当它落到地上, 然后每次弹出之后都弹出 。 -
Could you write
a piecewise function to model a ball dropped from
feet?
::您能写一个小字函数来模拟从 H0 英尺投下的球吗 ? -
Is there a
pattern
you could use to write the function up to any number of bounces?
::您是否有一种模式可以写入该函数, 直至任何弹跳次数 ?
Wrap-Up: Review Questions
::总结:审查问题Summary
::摘要Transformations can be used to fit a quadratic function to data or to model a scenario.
::变形可用于使二次函数适应数据或模拟假想。When creating a quadratic model in standard form, use the given characteristics to find and
::当以标准格式创建二次模型时,使用给定的特性查找 a、b和c。Each form of a quadratic equation has benefits:
::每种形式的二次方程都有好处:-
In vertex form, you can identify the vertex.
::在顶部形式中,您可以识别顶部。 -
In standard form, you can identify the y-intercept and factor the equation.
::在标准格式中,您可以识别 Y 界面,并对等式进行系数。 -
In factored form, you can identify the roots.
::以因素化的形式,您可以辨别根部。
-
Solve real-world problems by writing a
quadratic function
.