8.2 可视比较两种数据分布-interactive
章节大纲
-
Solar Solution
::太阳能解决方案Solar Powered House Many houses are using solar panels to save money and help the environment. However, the angle of the solar panels in relation to the sun can maximize the amount of money you save. The optimal angle for solar panels on your house can be determined by comparing data distributions. Comparing data distributions is used routinely across professions to make conjectures about data sets. One field in which this is commonly used is in science. Scientists use the scientific method to gather data in carefully designed experiments. They then compare that data to understand how changes in different factors can affect the data.
::许多房屋正在使用太阳能电池板来节省钱财和帮助环境。然而,太阳能电池板与太阳相比的角度可以使节省的钱财最大化。您家的太阳能电池板的最佳角度可以通过比较数据分布来确定。比较不同行业的数据分布通常用于比较数据集的推测。通常使用科学领域。科学家使用科学方法在精心设计的实验中收集数据。然后比较这些数据,以了解不同因素的变化如何影响数据。
Battery Life
::电池生命In the previous section, we learned about measures of center and measures of variability. Not only are measures of center and variability important in analyzing a data set , but they are also important in comparing data sets. We can use the measures of center to tell us which dataset will be more likely to produce a greater or lesser value. We can use measures of variability to compare which dataset will be more likely to stray from the mean. Additionally, we can use measures of variability to determine if one dataset has values that are significantly different from those in another dataset.
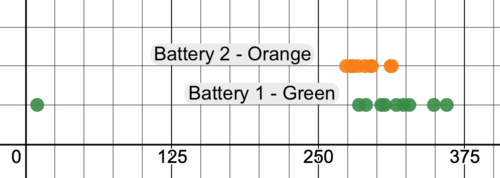
::在前一节中,我们了解了中心测量和可变度的测量方法。不仅在分析数据集中,中心测量和可变度非常重要,而且在比较数据集中也很重要。我们可以使用中心测量方法告诉我们哪些数据集更有可能产生较大或较小价值。我们可以使用可变度测量方法比较哪些数据集更有可能偏离平均值。此外,我们可以使用可变度测量方法来确定一个数据集是否有与另一个数据集中数值大不相同的数值。A computer company is designing a new tablet and is trying to determine the best battery to use. They decided to place one battery in 10 devices and the other battery in another 10 devices. The tablets were turned on, and the number of minutes, until the battery ran out was recorded for each device. The results are displayed below in a double dot plot .
::计算机公司正在设计新平板电脑, 并试图确定最佳电池。 他们决定将一个电池安装在10个设备中, 另一个电池安装在另外10个设备中。 平板电脑被打开, 分钟数被打开, 直到每个设备都记录到电池用完。 其结果在下面的双点图中显示 。-
Battery 1 (Green) - 307, 285, 349, 317, 360, 291, 10, 323, 304, 328
::电池1(绿色) - 307、285、349、317、360、291、210、323、304、328 -
Battery 2 (Orange) - 290, 313, 280, 278, 274, 280, 312, 295, 296, 284
::电池2(奥兰格) - 290, 313, 280, 278, 274, 280, 312、395, 296, 284
Double Dot Plot - Battery Life A double dot plot is useful in displaying this data because there are too many values for us to analyze mentally. Graphs like dot plats can help make relatively large sets of data easy to understand. We can see from the double dot plot above that Battery 1 has a center greater than that of Battery 2. Although more testing is required, we can infer from this sample that Battery 1 has a longer life. The test of Battery 1 had 7 results over 300, and Battery 2 had two results over 300. The actual mean of Battery 1 is 287.4, and the mean of Battery 2 is 290.2. The result of 10 minutes for Battery 1 is likely an outlier which weighs down the mean. Additionally, we can see that Battery 1 has a greater spread. This can be problematic when marketing a battery to have specific battery life. Although many results of the Battery 1 test were greater than those of the Battery 2 test, Only about half of the Battery 1 results fall outside of the range that you would expect to get for Battery 2.
::双点图有助于显示这些数据, 因为我们有太多的数值可以进行心理分析。 像点板这样的图可以帮助让相对大的数据组容易理解。 我们从上面的双点图中可以看到, 电池1的中心比电池2的中心要大, 虽然需要更多的测试, 我们可以从这个样本中推断出电池1的寿命更长。 电池1的试验结果超过300, 电池2的试验结果超过300。 电池1的实际平均值是287.4, 电池2的平均值是290.2。 电池1的10分钟结果很可能是一个外端, 其重量比平均值要低。 此外, 我们可以看到电池1的传播范围要大。 当销售电池需要特定的电池生命时, 这可能会有问题。 尽管电池1试验的许多结果比电池2的试验的结果要大, 电池1的结果只有大约一半位于你预期的电池2号范围之外。
Academic Achievement
::学术成就This first example involves the performance of the two classes on an exam. Two teachers, Mrs. Panthaki and Mr. Shields, wanted to compare the grades of their students on the yearly final exam. Both classes took the same test.
::第一个例子涉及两个班级的考试成绩,两名教师,Panthaki夫人和Sheelds先生,想在年度期末考试中比较学生的成绩,两个班级都进行了同样的考试。Use the interactive below to examine the results and compare the data.
::利用以下互动方式审查结果并比较数据。INTERACTIVEExam Grade Distribution-
Make predictions about the mean, MAD, and median of these two distributions.
::预测这两个分布的平均值、MAD和中位数。 -
Press the buttons to reveal information to compare the distributions.
::按下按钮披露信息以比较分布。
+Do you want to reset the PLIX?Discussion Questions
::讨论问题 讨论问题-
Which class would you say did better on the exam based on the graph?
::你说哪个班的考试成绩比较好? 根据图表? -
If the dot plots are not enough what could we use to determine which class performed better?
::如果圆点地块不够,我们用什么来确定哪一类的表现更好? -
Should we trust these findings?
::我们应该相信这些调查结果吗? -
How could the MAD and
interquartile range
help us in coming to this conclusion?
::MAD和跨种族范围如何帮助我们得出这一结论? -
How can comparing class performances on an exam be useful to a teacher?
::如何比较考试中的班级成绩对教师有用?
Solar Energy Comparison
::太阳能比较Now that you have seen an example of a problem which required a comparison between two data distributions, use your knowledge to examine a situation involving the angle of a solar panel. Solar energy produced from a solar panel is often measured in kiloWatts hours per square meter . The greater the value, the more energy stored.
::现在,你已经看到一个需要比较两种数据分布的问题的例子,利用你的知识来研究太阳能电池板的角度。太阳能电池板产生的太阳能通常以每平方米(kWh/m2)千瓦小时计量。 价值越大,储存的能源就越多。Use the interactive below to compare the results of two solar panels at different angles.
::使用下面的交互式数据,从不同角度比较两个太阳能电池板的结果。INTERACTIVESolar Energy ComparisonWhat angle is best for placing solar panels on a roof to utilize the most energy?
::将太阳能电池板放在屋顶上以利用最能量的最佳角度是什么?-
Drag the red points on the two blue solar panels to choose an angle.
::拖曳两个蓝色太阳能电池板上的红色点以选择角度。 -
Press the white buttons to take recordings and view information about them.
::按下白色按钮拍摄录音并查看有关它们的信息。
+Do you want to reset the PLIX?Discussion Questions
::讨论问题 讨论问题-
Based on the data taken, which angle do you believe produced the most solar energy?
::根据数据,你认为哪个角度 产生最太阳能? -
What might cause the differences in variability?
::是什么原因造成差异性的差异?
Summary -
The
mean
of a data set (also known as the average) is the sum of the data values divided by the number of data values in the set.
::数据集的平均值(也称为平均值)是数据值除以数据集中数据值数的总和。 -
The
mean absolute deviation (MAD)
is the measure of variability that is used to measure how spread out the values in the data set are.
::平均绝对偏差(MAD)是用于衡量数据集中数值分布方式的可变性度。
-
Battery 1 (Green) - 307, 285, 349, 317, 360, 291, 10, 323, 304, 328