8.2 概率分布-interactive
章节大纲
-
Lesson Objectives
::经验教训目标-
Analyze
decisions and strategies using probability concepts
::使用概率概念分析决定和战略 -
Find the
and
standard deviation
of a probability model.
::查找概率模型的标准偏差。
Introduction: Predicting Hurricanes
::导言:预测飓风An image of a hurricane Nina is a meteorologist studying major Atlantic hurricanes. The ability to predict hurricanes is important in preemptively allocating the appropriate resources to support those in affected areas. Nina used extensive data over the past 150 years to create the probability distribution below. The x column represents the number of major Atlantic hurricanes that happen in a year in states along the southern border. The P(x) column represents the probability that the corresponding number of major Atlantic hurricanes will occur in a year.
::尼娜是研究主要大西洋飓风的气象学家,预测飓风的能力对于先发制人地分配适当资源以支持受影响地区的灾民非常重要。尼娜利用过去150年的大量数据得出下面的概率分布。x列是南部边界各邦一年中发生的重大大西洋飓风的数量。P(x)栏是一年中发生相应重大大西洋飓风的概率。x P(x) 0 18.6% 1 28.7% 2 26.9% 3 9.0% 4 5.4% 5 5.4% 6 4.2% 7 1.2% 8 0.6% The statement P(4) = 5.4% means that there is a 5.4% probability that exactly 4 major Atlantic hurricanes will occur during a calendar year.
::说明P(4)=5.4%意味着,在一个日历年内,确切的4次主要大西洋飓风发生概率为5.4%。Discussion Question: How many major hurricanes can a state along the southern Atlantic border expect?
::讨论问题:大西洋南部边界一带的一个国家预期会遭受多少大飓风?
Activity 1: Predicting Hurricanes Continued
::活动1:预测飓风A probability distribution is a function that describes the possible values that a random variable can take on. The combined probability of all outcomes must be 100%. A random variable is a variable that takes on multiple values based on varying probabilities. In this section, we will be looking at discrete random variables . A discrete random variable is a random variable that can take on a finite number of values over a given interval . The of a probability distribution is the mean value of a variable weighted by the probabilities.
::概率分布是一个函数,它描述随机变量可以接受的可能值。所有结果的合并概率必须是100%。随机变量是一个根据不同概率计算多个值的变量。在本节,我们将查看离散随机变量。离散随机变量是一个随机变量,可以在给定间隔内取用一定数量的数值。概率分布的平均值是按概率加权的变量的平均值。Example
::示例示例示例示例Find the expected value of the probability distribution above.
::查找以上概率分布的预期值 。Imagine that we simulated 1,000 years’ worth of data that worked out perfectly according to the probability distribution above. We should expect the following data:
::想象一下,我们模拟了1000年的数据价值,这些数据根据上述概率分布完全计算出来。Number of Major Atlantic Hurricanes Frequency 0 186 1 287 2 269 3 90 4 54 5 54 6 42 7 12 8 6 If we wanted to find the mean of this data, we could add up all of the individual values in the table and divide by 1,000. Remember that we are adding up the frequencies , which represent the number of trials .
::如果我们想要找到这些数据的平均值,我们可以将表格中的所有个人值加起来,再除以1000。 记住我们正在将频率加起来,这代表了试验的数量。0 + 0 + 0 + … + 8 + 8 + 8 1 , 000
We can take a quicker approach by using the product of the number of major Atlantic hurricanes and the number of times it happened.
::我们可以采取更快的办法,利用主要大西洋飓风次数和发生次数的产物。0 ( 186 ) + 1 ( 287 ) + 2 ( 269 ) + 3 ( 90 ) + 4 ( 54 ) + 5 ( 54 ) + 6 ( 42 ) + 7 ( 12 ) + 8 ( 6 ) 1 , 000 = 1.965
Another way to get the expected value is to project the data over one year. This will require us to weigh each result based on its probability. Rather than saying that 0 major Atlantic hurricanes happen 186 times out of 1,000, we are saying that 0 major Atlantic hurricanes happen .186 times out of the 1. We can then follow the same process as above, weighting each result based on its probability.
::获得预期值的另一个方法是预测一年多的数据。 这将要求我们根据每个结果的概率来权衡每个结果。 我们不是说在1000次中发生10次主要大西洋飓风186次,而是说在1次中发生10次主要大西洋飓风186次,我们可以遵循上述同样的进程,根据每个结果的概率来加权。Number of Major Atlantic Hurricanes Frequency 0 0.186 1 0.287 2 0.269 3 0.090 4 0.054 5 0.054 6 0.042 7 0.012 8 0.006 0 ( 0.186 ) + 1 ( 0.287 ) + 2 ( 0.269 ) + 3 ( 0.090 ) + 4 ( 0.054 ) + 5 ( 0.054 ) + 6 ( 0.042 ) + 7 ( 0.012 ) + 8 ( 0.006 ) 1
Since the probabilities in a probability distribution will always add up to 1, dividing by 1 becomes an unnecessary step since anything divided by 1 is itself.
::由于概率分布概率的概率将总是相加为1,除以1成为不必要的一步,因为任何除以1是本身。0 ( 0.186 ) + 1 ( 0.287 ) + 2 ( 0.269 ) + 3 ( 0.090 ) + 4 ( 0.054 ) + 5 ( 0.054 ) + 6 ( 0.042 ) + 7 ( 0.012 ) + 8 ( 0.006 ) = 1.965
Answer: In one year, we can expect 1.965 or approximately 2 major Atlantic hurricanes.
::答复:一年后,我们预计会有1.965或大约2次大西洋飓风。Discussion Question: Make a conjecture about the expected value of a fair n-sided number cube with sides labeled from 1 to n landing on the nth side.
::讨论问题:猜测一个公平的正方形立方体的预期价值,其侧面标记为从1到N降落在第n侧。
Activity 2: Selling a House
::活动2:卖房Expected value, also known as the mean, is essential to risk management for businesses, entrepreneurs, and even in the everyday decisions that we make. Imagine that you have to choose between studying for a math test and a science test, both scheduled for tomorrow. There are many variables that will influence how you will split up your study time, like how much material is on the test, how difficult each class is , etc. We have to make decisions like this all the time. For example, should you buy a warranty on a new TV? Should you buy the more expensive product from a trustworthy seller or a less expensive product from a seller that isn’t as trustworthy? Expected value can help us make these decisions, but before we make them, it is important to do enough research so that we can estimate the probabilities of things going well and things going poorly for each choice.
::期望值(也称为平均值)对于企业、企业家的风险管理至关重要。 即使在我们所做的日常决策中,预期值对于企业、企业家的风险管理也至关重要。 想象一下,你必须在数学测试和科学测试之间做出选择,两者都定于明天进行。 有许多变量会影响你的学习时间的分割,比如测试中有多少材料,每个班级有多难,等等。 我们必须始终做出这样的决定。 比如,你是否应该在新电视上购买保修品? 如果你从一个值得信赖的卖家那里购买更昂贵的产品,或者从一个不值得信赖的卖家那里购买更昂贵的产品? 期望值可以帮助我们做出这些决定,但在我们做这些决定之前,必须做足够的研究,以便我们可以估计每选择的好坏事物的概率。Example
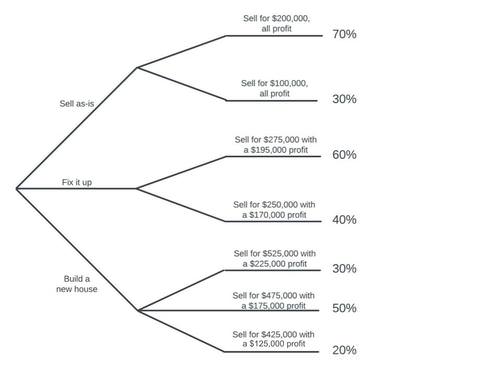
::示例示例示例示例Max is selling a house that needs a lot of work. He is trying to determine whether to sell the house as-is, fix up the run-down house, or tear it down and build a new one. Fixing up the house will cost approximately $80,000, and building a new house will cost approximately $300,000. To figure this out, he runs a risk assessment analysis and determines the following:
::马克斯正在卖房子,这需要大量工作。他试图确定是按原样卖掉房子,修复破旧的房子,还是拆掉房子并建造新的房子。 修复房子需要大约80 000美元,建造新房子需要大约300 000美元。 为了弄清这一点,他进行了风险评估分析,确定如下:House Options Tree Similar to the process in activity 1, we can find the expected value by multiplying the profits by their respective probabilities with the sum representing the expected value. However, we must realize that there are three separate scenarios represented above. To compare the scenarios, we must find their respective expected values.
::与活动1的过程类似,我们可以通过利润的概率乘以各自的概率和代表预期价值的金额来找到预期价值。然而,我们必须认识到,上面有三种不同的假设情况。为了比较这些假设情况,我们必须找到各自的预期价值。As-Is
::A - 拥有者Profit, x Probability P(X) x • P(x) 200,000 70% 140,000 100,000 30% 30,000 As-is expected profit = $170,000
::预期预期利润=170 000美元Fix-Up
::修整Profit, x Probability, P(x) x • P(x) 195,000 60% 117,000 170,000 40% 68,000 Fix-up expected profit = $185,000
::固定预期利润=185 000美元Rebuild
::重建重建Profit, x Probability, P(x) x • P(x) 225,000 30% 67,500 175,000 50% 87,500 125,000 20% 25,000 Rebuild expected profit = $180,000
::重建预期利润=180 000美元Answer: Fixing up the house will offer the most expected profit.
::答复:修复房屋将带来最预期的利润。Although fixing up the house offers the greatest expected profit, Max might elect to build a new house since that offers the greatest potential profit at $225,000. However, we also have to consider other variables like the time when making these decisions; building a new house takes up to about six months. Additionally, all of these choices are not necessarily mutually exclusive; Max may choose to try to sell the house as-is for $200,000 before choosing to fix it up if it does not sell by a set deadline. Expected value offers us one piece of a larger puzzle when making decisions. Use the interactive below to explore this further.
::虽然修缮房屋带来最大的预期利润,但Max可能选择建造新房子,因为新房子可能带来最大的潜在利润225 000美元。然而,我们也必须考虑其他变量,比如做出这些决定的时间;建造新房子需要大约6个月的时间;此外,所有这些选择并不一定是相互排斥的;Max可能选择尝试以20万美元的价格出售房屋,然后再选择在固定的最后期限内进行修复。预期价值给我们提供了决策时更大的难题之一。用下面的互动来进一步探讨这一点。Discussion Question: Is it possible that someone could choose the best option based on risk management, but it ends up being the wrong choice? With this in mind, does it matter what choice is made? Would it matter if the choice is based on risk management or made at random?
::讨论问题:有人能否在风险管理的基础上选择最佳选择,但最终却是错误的选择?考虑到这一点,作出什么选择是否重要?选择是基于风险管理还是随机作出的,这是否重要?
Activity 3: Selling a House Continued
::活动3:继续出售房屋The standard deviation of a dataset tells us the spread of the data. In that context, if the probability distribution has a relatively low standard deviation, it means that we can expect to make around the expected value. If the probability distribution has a relatively high standard deviation, it means that the option isn’t as safe but provides opportunities for high or low rewards. The more spread out the potential profits, the more chance there is to gain or lose money.
::数据集的标准偏差告诉我们数据传播情况。 在这种情况下,如果概率分布的标准偏差相对较低,这意味着我们可以期望围绕预期值做出选择。 如果概率分布的标准偏差相对较高,则意味着选项并不安全,而是提供了高或低回报的机会。 潜在利润越多,获得或失去资金的机会就越大。Example
::示例示例示例示例Find the standard deviation of the probability distribution constructed for selling the house as-is.
::查找为按原样出售房屋而建造的概率分布的标准偏差。Let’s first consider the probability distribution for selling the house as-is.
::让我们首先考虑出售房屋的概率分布。Profit, x Probability, P(x) 200,000 70% 100,000 30% If we were to use this probability distribution to simulate a frequency distribution based on 10 trials, we would get the following, assuming the frequency distribution matched the probability distribution perfectly.
::如果我们使用这种概率分布模拟频率分布 以10个测试为基础, 我们会得到以下结果, 假设频率分布与概率分布完全吻合。Profit, x Frequency, f 200,000 7 100,000 3 The frequency distribution above would represent the following dataset:
::上述频率分布将代表以下数据集:( 200000 , 200000 , 200000 , 200000 , 200000 , 200000 , 200000 , 100000 , 100000 , 100000 )
We know how to find the standard deviation of a frequency distribution using the following formula:
::我们知道如何使用以下公式找到频率分布的标准偏差:√ Σ ( f ⋅ ( x − 𝜇 ) 2 ) Σ f
:x)2f
-
𝜇
is the mean
::~ 是平均值 ~ -
f
represents the frequencies of the values in the
data set
.
::f 表示数据集中值的频率。 -
x
represents each value in the dataset.
::x 代表数据集中的每个值。 -
Σ
is not a variable, it is the symbol for summation which means to add multiple values.
::不是变量,而是总和的符号,这意味着添加多个值。
Let's replace the variables with their respective values.
::让我们用各自的数值来取代变量。- 𝜇 = 200 , 000 ( 7 ) + 100 , 000 ( 3 ) 10 = 170 , 000
-
Σ
f
means to add all the frequencies,
Σ
f
=
7
+
3
=
10.
::=f 表示要添加所有频率, = 7+3= 10。 -
Σ
(
(
x
−
µ
)
²
⋅
f
)
means subtracting each value in the data set from the mean, then squaring the difference, and then multiplying by the frequency. This is the same as the usual standard deviation process, only weighted.
:
The two values in the dataset are 200,000 and 100,000. We must subtract each one from the mean, square the result, and then multiply by the frequency. Making a table is a great way to organize this.
::数据集中的两个值是 20 万 和 10 万 。 我们必须从平均值中减去每个值, 将结果平方, 然后乘以频率 。 制作一个表格是组织这个的好方法 。x x - µ (x - µ)² f f•(x - µ)² 200,000 30,000 900,000,000 7 6,300,000,000 100,000 -70,000 4,900,000,000 3 14,700,000,000 Σ ( f ⋅ ( x − 𝜇 ) 2 ) = 21 , 000 , 000 , 000 √ Σ ( f ⋅ ( x − 𝜇 ) 2 ) Σ f ≈ $ 45 , 825.76
:In activity 1, we saw that a probability distribution could be thought of as a frequency distribution with a frequency of 1. We can follow the same steps as we did above; only the frequency will be referred to as the probability, and Σ f , referred to as Σ P ( x ) . Σ P ( x ) will equal 1 because the probability of all possible outcomes will sum to 1. D ividing by Σ P ( x ) is an unnecessary step since anything divided by 1 is itself. We will use the probability table from the beginning of the activity, only we will write the percentages as decimals for convenience.
::在活动1中,我们看到,概率分布可被视为频率分布,频率为1。 我们可以采取与上文相同的步骤; 只有频率将被称作概率, 而f, 被称为P(x). P(x) P(x) 将等于1, 因为所有可能的结果的概率都等于1。 P(x) 的概率分配是一个不必要的步骤, 因为除以1的任何部分本身都是一部分。 我们将从活动一开始使用概率表, 仅为方便起见, 我们只将百分比写为小数 。Profit, x Probability, P(x) 200,000 0.7 100,000 0.3 𝜇 = 200 , 000 ( 0.7 ) + 100 , 000 ( 0.3 ) 1 = 170 , 000
x x - µ (x - µ)² P(x) P(x)•(x - µ)² 200,000 30,000 900,000,000 0.7 630,000,000 100,000 -70,000 4,900,000,000 0.3 1,470,000,000
√ Σ ( P ( x ) ⋅ ( x − 𝜇 ) 2 ) = √ 630 , 000 , 000 + 1 , 470 , 000 , 000 ≈ $ 45 , 825.76
:Answer: The standard deviation of the as-is probability distribution is $45,825.76.
::答复:原概率分布的标准偏差为45 825.76美元。The answer for standard deviation is the same as above; however, we now have a much simpler way of finding it. We can state the formula for finding the standard deviation, 𝝈, of a probability distribution as follows:
::标准偏差的答案与上文相同;然而,我们现在找到标准偏差的方法简单得多。 我们可以说明找到标准偏差的公式,即概率分布的公式 :𝝈 = √ Σ ( P ( x ) ⋅ ( x − 𝜇 ) 2 )
:-
𝝈 is the standard deviation
::XIII 是标准偏差 -
P
(
x
)
is the probability of each event
::P(x) 是每个事件的概率 -
Σ
is the summation of the probability of each event multiplied by its squared difference from the mean.
::=每一事件的概率乘以其与平均值的正方差。 -
x
represents each value in the dataset.
::x 代表数据集中的每个值。
The formula for variance will be the square of the formula for standard deviation.
::差异公式将是标准差公式的平方。𝝈 2 = Σ ( P ( x ) ⋅ ( x − 𝜇 ) 2 )
::282(P(x)(x)2)Use the interactive below to determine which option for selling the house has the least standard deviation.
::使用以下互动方式确定出售房屋的哪一种选择标准差最小。Discussion Question: Since both the sell as-is and the rebuild probability distributions have a range of $100,000, why does as-is have a greater standard deviation than rebuild?
::讨论问题:既然原销售额和重建概率分布的幅度都在10万美元之间,为什么原销售额的标准偏差大于重建?Summary -
A
probability distribution
is a function that describes the possible values that a random variable can take on.
::概率分布是一个函数,它描述随机变量可以接受的可能值。 -
A
random variable
is a variable that takes on multiple values based on varying probabilities.
::随机变量是一个基于不同概率的多个值的变量。 -
A
discrete random variable
is a random variable that can take on a finite number of values over a given interval.
::离散随机变量是一个随机变量,可以在给定间隔内取用一定数量的数值。 -
The
expected value
of a probability distribution is the mean value of a variable weighted by the probabilities.
::概率分布的预期值是按概率加权的变量的平均值。 -
The formula for finding standard deviation of a frequency distribution is
√ Σ ( f ⋅ ( x − μ ) 2 ) Σ f
::查找频率分布标准偏差的公式为(f(x)2)f -
The formula for finding standard deviation of a probability distribution is
σ = √ Σ ( P ( x ) ⋅ ( x − μ ) 2 )
::查找概率分布标准偏差的公式为(P(x)(x)2)
Wrap-Up: Review Questions
::总结:审查问题 -
Analyze
decisions and strategies using probability concepts