9.1 抽样-interactive
章节大纲
-
Lesson Objectives
::经验教训目标-
Understand
statistics
as a process for making inferences about
population
parameters based on a
random sample
from that population.
::将统计作为一种根据人口随机抽样推断人口参数的过程来理解。 -
Recognize the purposes of and differences among
sample
surveys, experiments, and observational studies; explain how
randomization
relates to each.
::承认抽样调查、实验和观察研究的目的和差异;解释随机化与每项调查、实验和观察研究的关系。 -
Recognize the purposes and differences among sampling methods.
::承认采样方法的目的和差异。 -
Find the mean and
standard deviation
of a sample.
::找出样本的平均值和标准偏差。
Introduction: Clean Water
::导言:清洁水An image of groundwater. The local government wants to know if the groundwater in Shawnee, Kansas, is clean. Clean groundwater is vital to the health and well-being of people, animals, and vegetation in the area. City officials took a reading from one location in the city and found that the groundwater has slightly high levels of nitrate, which can be especially dangerous to infants.
::地方政府想知道堪萨斯州Shawnee的地下水是否干净。 清洁地下水对该地区的人、动物和植被的健康和福祉至关重要。 城市官员从城市的一个地点读到,发现地下水的硝酸盐含量略高,这对婴儿特别危险。Discussion Question: Is this enough information to determine whether or not the groundwater for the entire town has high levels of nitrate? What information would need to be considered to make this determination?
::讨论问题:这一信息是否足以确定整个城镇的地下水是否有高水平的硝酸盐?在作出这一确定时需要考虑哪些信息?
Activity 1: Methods of Data Collection
::活动1:数据收集方法To answer the question posed in the introduction, we need to collect data . T here are two approaches to data collection that we will explore in this section: observational studies and experiments.
::为了回答导言中提出的问题,我们需要收集数据,本节将探讨数据收集的两种方法:观测研究和实验。An observational study is when a researcher observes and measures variables without trying to influence them. Observational studies are often performed when it is unethical or inconvenient to experiment on or control variables. In an observational study, correlations between two variables can be determined. Correlations between variables are referred to as associations; it is not possible to determine cause and effect through an observational study. Surveys are an example of an observational study. A survey is the collection of data from a segment of the population to make inferences about the characteristics of the population as a whole.
::观察研究是指研究人员观察和测量变量而不试图影响变量时;观察研究往往是当实验或控制变量不道德或不方便时进行的;在观察研究中,可以确定两个变量之间的相互关系;变量之间的关联被称为联系;不可能通过观察研究确定因果关系;调查是观察研究的一个实例;调查是从一部分人口收集的数据,以推断整个人口的特点。An experiment is a controlled study where the researcher purposely alters certain variables and measures the change in the other variables. The alteration of a variable is often referred to as a treatment . When conducting an experiment, a control group is needed to measure the effect of the treatment. A control group is a group that does not receive treatment. This manipulation of variables allows researchers to determine causation : the cause and effect relationship between associated variables. An experiment should not be performed if it could harm the subjects.
::一项实验是受控制的研究,由研究人员故意改变某些变量并测量其他变量的变化。变数的改变通常被称为一种治疗。在进行实验时,需要有一个控制组来测量治疗的效果。控制组是一个不接受治疗的组。这种变数操纵使研究人员能够确定因果关系:相关变量之间的因果关系。如果实验可能损害对象,则不应进行实验。Example
::示例示例示例示例Jack wants to know if listening to music with headphones for more than 60 minutes per day affects hearing. Would an observational study or an experiment be more useful?
::杰克想知道用耳机每天听60多分钟的音乐是否会影响听力。 观察研究或实验是否更有用?Answer: An observational study would be done since it would be considered unethical to have a control group (no headphones) and a treatment group (with headphones) whose hearing might be damaged as a consequence of the study.
::答复:将进行观察研究,因为拥有一个控制小组(无耳机)和一个听力可能因研究而受损的治疗小组(无耳机)将被视为不道德。Observational Study Experiment -
Variables not manipulated
::未操纵的变量 -
No treatment applied
::没有适用治疗 -
No control group
::无控制组 -
Identifies association
::确定协会
-
Variables manipulated
::被操纵的变数 -
Treatments applied
::适用的待遇 -
Control group
::控制组 -
Identifies a cause and effect
::说明原因和效果
Activity 2: Sampling
::活动2:抽样In the question posed in the introduction, it is impossible to test all groundwater in the city. Additionally, by the time you might have tested every location, the circumstances may have changed. Scenarios where it is physically infeasible and too time-consuming to test an entire population call for sampling. Sampling is the practice of using data obtained from a group to represent a population. A population is a group of objects with a common characteristic. The group selected from the population is called a sample . In the example above, the sample would be the groundwater from Shawnee used for testing, and the population would be all groundwater in Shawnee. When using numbers to describe populations and samples, these numbers are referred to as parameters and statistics, respectively. When data is collected from every individual member of the population to obtain a parameter , this is called a census .
::在导言中提出的问题中,不可能对城市内的所有地下水进行检验,此外,在你可能测试每个地点时,情况可能已经改变。在实际中,检验整个人口要求抽样是不可行的,而且太费时。抽样是使用从一个群体获得的数据来代表人口的做法。人口是具有共同特征的一组物体。从人口中选出的一组物体称为抽样。在上文的例子中,抽样是用于检测的Shawnee的地下水,人口是Shawnee的所有地下水。在使用数字来描述人口和样品时,这些数字分别称为参数和统计。在从每个人口个体收集数据以获得参数时,这称为普查。Example
::示例示例示例示例A state conducts an election for a governor. A local news outlet conducted a poll of 1,200 voting-eligible residents and found that Joseph Davis was the leading candidate, with 72% of the residents polled claiming that they will vote for him. Joseph Davis went on to win with 81% of the vote. Identify the population, sample, parameter, and statistic .
::州政府进行州长选举。 当地一家新闻网对1200名符合投票资格的居民进行了民意测验,发现约瑟夫·戴维斯是主要候选人,72%的居民被民意测验为他们将投票支持他。 约瑟夫·戴维斯继续以81%的选票获胜。 确定人口、抽样、参数和统计。The sample in this scenario is the 1,200 residents polled. The statistic is that 72% of residents polled supported Joseph Davis. The population is the group of people that the sample is being used to represent: all voters in the state. The parameter is the 81% of voters who voted for Joseph Davis.
::这一假设中的抽样是1 200名居民,统计数字是72%的居民支持约瑟夫·戴维斯。人口是样本用来代表的群体:州内的所有选民。参数是81%的选民投票支持约瑟夫·戴维斯。Use the interactive below to practice identifying populations, samples, parameters, and statistics.
::利用以下互动方式确定人口、样本、参数和统计。
Activity 3: Sampling Methods
::活动3:抽样方法A good sample minimizes the potential for bias . Bias is the difference between a parameter and its corresponding statistic. Bias can be due to poor sampling practices or to the inherent nature of sampling. To reduce bias, a good sample should be appropriately sized and randomized so that it is representative of the whole population. Randomization is the process of making something random . When conducting an observational study or experiment, it is important to reduce bias as much as possible. In an experiment, the subjects are assigned to different groups. The subjects must be assigned randomly to ensure that each group is representative of the population. When conducting a study, samples are taken in an attempt to estimate population parameters. It is again important that the samples are collections of randomly chosen members of the population to ensure a representative sample . Below, we will explore some of the methods that are used to ensure a random and representative sample.
::良好的样本最大限度地缩小了偏差的可能性。Bias是参数及其相应统计数据之间的差别。Bias可能是由于抽样做法差或抽样的固有性质造成的。为了减少偏差,好的样本应该适当大小和随机化,以便代表整个人口。随机化是一个随机的过程。当进行观察研究或实验时,必须尽量减少偏差。在实验中,对象被分配到不同的群体。必须随机分配这些对象以确保每个群体代表人口。在进行研究时,要进行抽样,以便估计人口参数。同样重要的是,抽样是随机挑选的人口成员收集的,以确保有代表性的样本。下面,我们将探讨一些用来确保随机和有代表性的样本的方法。Simple Random Sampling
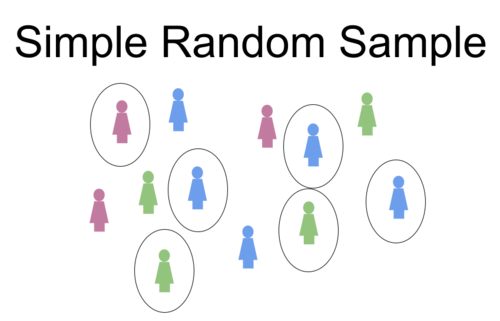
::简单随机随机抽样When taking a simple random sample , the idea is that each sample grouping of the population is equally likely. A simple example of this can be drawing names from a hat. However, this is more commonly done by assigning each member of the population a number and using an algorithm to generate numbers in an approximately random way. A company might assign number-based user IDs to its customers and email a survey to those that have been randomly selected by an algorithm. In the example from the introduction, an algorithm could be used to generate random GPS coordinates within the city limits to be tested.
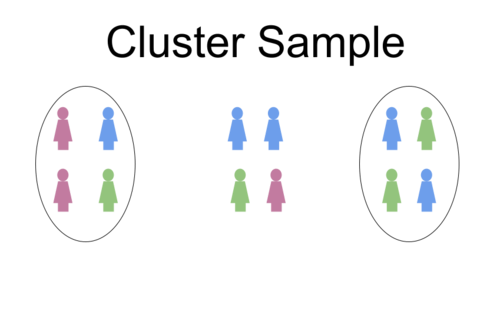
::当进行简单的随机抽样时,其想法是每个抽样组群的人口都具有同样的可能性。一个简单的例子是从帽子中绘制名称。然而,这更常见的做法是,向每个人口成员指定一个数字,并使用算法以大致随机的方式生成数字。公司可以向其客户指定基于数字的用户身份,并将调查电子邮件给通过算法随机挑选的人。在引言中的例子中,可以使用算法在城市范围内生成随机的GPS坐标进行测试。A cluster sample involves separating the population into groups, usually based upon a similar characteristic like geographic location. The sample is then made up of randomly chosen groups. This is often done when it is difficult to obtain data from all clusters . For example, if a company wanted to study the sales of a product, they might choose to look at several stores chosen at random. This would be the case if it were too difficult, time-consuming, or expensive to collect data from every store. In this scenario, each store would be a cluster. One of the cons of cluster sampling is that it can be greatly affected by bias. If you choose a relatively small number of clusters, one cluster with an abnormally high data value could greatly affect the statistic. For example, if a political poll is being conducted, residents in the same geographical location may be more likely to vote for one candidate over another for any number of reasons. In the example from the introduction, we could perform a cluster sample by dividing the city into a coordinate grid. Each cluster would be a segment of the grid chosen randomly and tested extensively.
::集束样本涉及将人口分为不同组群,通常基于与地理位置相似的特征,然后由随机选择的组群组成,通常在难以从所有组群获得数据时进行。例如,如果公司想研究产品的销售情况,它们可能选择随机选择若干商店。如果从每家商店收集数据过于困难、耗时或费用太高,情况就属于这种情况。在这种情况下,每家商店都是一个组群。组群抽样的一个因素是它可能受到偏见的极大影响。如果选择相对较少的组群,一个数据价值异常高的组群可能会对统计产生很大影响。例如,如果进行政治民意测验,同一地理位置的居民可能因任何原因更可能投票选举一个候选人。在导言中,我们可以通过将城市分为一个协调网格来进行集样本。每个组群群群将是一个随机选定并广泛测试的网格部分。Stratified Sampling
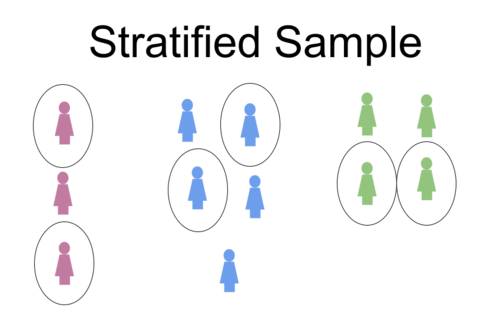
::分层抽样Stratified sampling is similar to cluster sampling in that it involves dividing the population into groups. The difference is that, instead of dividing the groups geographically, these groups are divided by strata , a common characteristic. A set number of members are then randomly chosen from each group in a ratio that is often proportionate to that of the population. This process can avoid bias presented by cluster sampling. For example, if a political poll is being conducted and the researcher believes that socioeconomic status might have a factor in a person’s decisions, the population may be broken up into groupings of low-income, middle-income, and high-income voters. A proportionate number of people from each group would then be randomly chosen for the sample. Stratified sampling could be employed to the scenario from the introduction by dividing the city into a coordinate grid and then taking 5 readings from each grid segment. Use the following activity to explore how population proportions affect the strata.
::分层抽样与组群抽样相似,因为它涉及将人口按群体划分,不同之处在于,这些组群不是按地域划分,而是按阶层划分,这是共同的特征。然后,从每个组群中随机抽选一定数目的成员,其比例往往与人口比例相称。这一过程可以避免分组抽样显示的偏差。例如,如果进行政治民意测验,而且研究者认为社会经济地位在个人决策中可能具有某种因素,那么人口可能会被分成低收入、中等收入和高收入选民群体。然后,每个组群将随机选择一定比例的抽样人数。从引入到引入时,可将城市分为一个坐标网,然后对每个网块进行5次读取。使用以下活动来探索人口比例如何影响阶层。Systematic Sampling
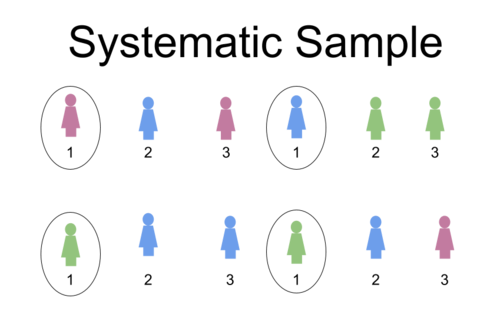
::系统抽样The goal of systematic sampling is to ensure that the members of the population chosen for the sample are spread out within the population. In the systematic sampling process, every nth member of the population, which has been arranged in some order, is chosen for the sample. Systematic sampling is commonly done in quality testing: a computer company might test every 100th device for defects. If the company did simple random testing, it would be possible that the majority of devices could be from the same general period in time or made by the same machine. This result could lead the company to believe that the actual percent of defective devices is either greater than or less than reported. We could perform a systematic sampling to measure the groundwater levels by dividing the city into a coordinate grid, assigning each grid a number, and taking a set number of samples from every nth grid number.
::系统取样的目标是确保为抽样所选择的人口在人口中的分布; 在系统取样过程中,为抽样选择每个按一定顺序排列的人口的N级成员; 系统取样通常是在质量测试中进行的:计算机公司可以测试每100个装置的缺陷; 如果公司进行简单的随机测试,大多数装置有可能是同一一般时期的,或者是由同一机器制造的; 其结果可能导致公司相信有缺陷装置的实际百分比大于或低于所报告的比例; 我们可以进行系统取样,通过将城市分为一个坐标网,分配每个网格的数目,并从每个网格号码中抽取一定数量的样品来测量地下水水平。Convenience Sampling
::便利性抽样Convenience sampling is a sampling process where data is collected in a way that is easy to obtain. Although convenience sampling is a method of sampling, it is not random. As a result, of the methods discussed in this section, convenience sampling is the most prone to bias. Convenience sampling is often done in scenarios where the results are not used as evidence for major decisions, and thus there is leeway in the need for accuracy. For example, if a magazine wants to determine what percentage of people have listened to a music star’s new album, they might just go to a mall and ask people who walk by. The purpose of this study is to get a general idea of the parameter. A convenience sample could be taken when testing groundwater levels by taking 5 readings that are relatively close together in geographic location.
::方便抽样是一种抽样过程,其数据收集方式容易获得。虽然方便抽样是一种抽样方法,但它不是随机的。因此,在本节讨论的方法中,便利抽样最容易产生偏差。便利抽样往往在结果不被用作重大决策证据的情况下进行,因此需要准确性。 例如,如果杂志想确定听音乐明星新专辑的人占多大比例,他们可能只是去商场询问路过的人。本研究的目的是了解参数的一般概念。在测试地下水水平时,可以通过比较接近地理位置的5种读数进行方便抽样。Surveys are another example of a convenience sample. Many surveys may have a non-response bias , meaning that there are too few responses when compared to the number of surveys given out. People who are too busy to reply, unable to understand the questions, or simply not interested will be excluded from the results. Self-selected respondents tend to have stronger opinions on subjects than others and are more motivated to respond. In this way, they may cause bias. For this reason, phone-in and online polls also tend to be poor representations of the overall population. Even though it may appear that all viewpoints are represented, the poll may disproportionately represent extreme viewpoints while ignoring more moderate opinions that may be the majority view. Self-selected polls are generally regarded as unscientific.
::方便抽样调查是另一个方便抽样调查的例子。 许多调查可能有不答复的偏差,这意味着与调查数量相比,答复太少。 忙于回答、无法理解问题或完全不感兴趣的人将被排斥在结果之外。 自选的受访者对主题的意见往往比其他人更强,更愿意回答。这样,他们可能会造成偏差。因此,电话和在线民意测验也往往代表整个人口的不好。尽管所有观点似乎都有代表,但民意测验可能不成比例地代表极端观点,而忽视可能是多数人观点的较温和观点。自选的民意测验通常被视为不科学。Using multiple methods of sampling in a study is referred to as multi-stage sampling . Use the interactive below to explore the types of sampling further.
::在一项研究中使用多种取样方法称为多阶段取样,使用以下互动方式进一步探讨取样类型。Discussion Question: Would it be possible to take a sample with no bias? Under what conditions could this occur?
::讨论问题:能否进行无偏差的抽样?在什么条件下可以这样做?
Activity 4: Sample Mean and Standard Deviation
::活动4:抽样平均值和标准偏离When finding the mean of a sample, we simply find the mean of all data values in the sample, just as we do with the population. To represent the mean of a sample, we use the symbol x̄, x-bar, instead of 𝜇, which we use to identify the mean of a population. Additionally, to represent the size of a sample, we use the lowercase n as opposed to the capital N that we use to represent the size of a population.
::当找到样本的平均值时,我们只要找到样本中所有数据值的平均值,就像我们对待人口一样。为了代表样本的平均值,我们使用符号 x , x bar,而不是微克,我们用来确定人口值的平均值。此外,为了代表样本的大小,我们使用小写 n ,而不是我们用来代表人口规模的资本 N。Example
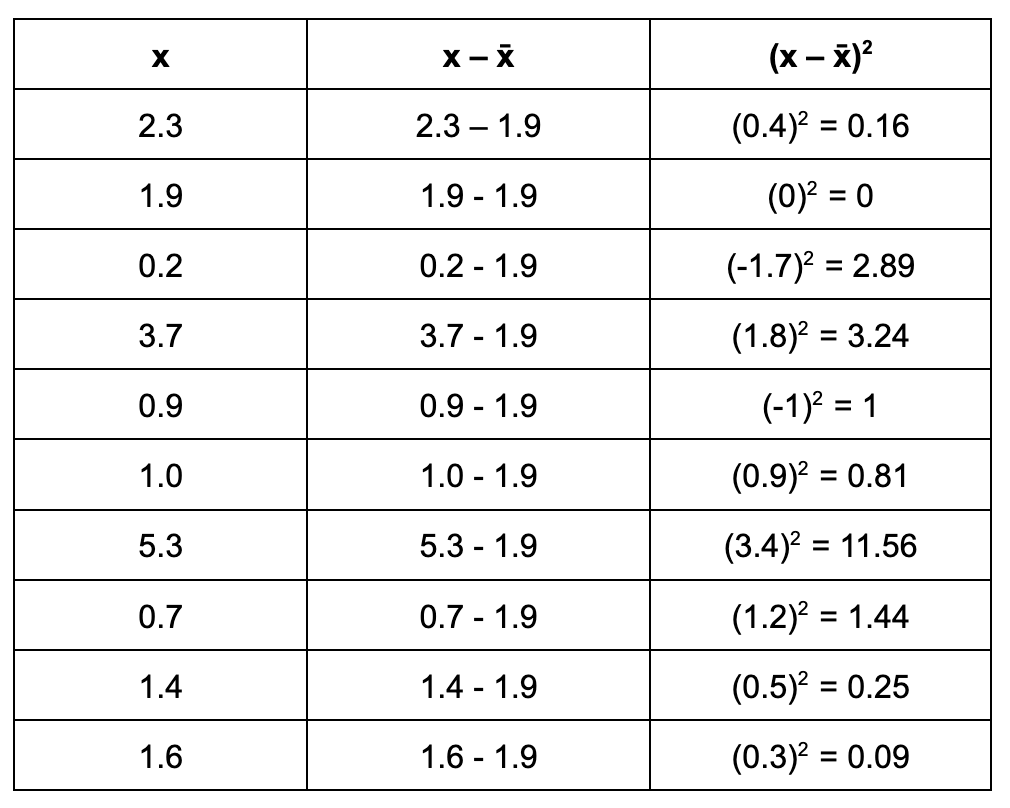
::示例示例示例示例A specialist is called in to measure the groundwater in Shawnee. Any readings of 3 mg/L or below of Nitrate are considered safe to drink, and any readings greater than 3 mg/L are considered unsafe. After taking a simple random sample from 10 different locations throughout the city, the specialist obtained the following sample:
::请专家测量Shawnee的地下水,认为任何读数3毫克/升或低于3毫克/升的硝酸盐均安全饮用,任何读数超过3毫克/升的值被视为不安全。2.3 , 1.9 , 0.2 , 3.7 , 0.9 , 1.0 , 5.3 , 0.7 , 1.4 , 1.6
What is the mean Nitrate concentration of the sample?
::样本的硝酸盐浓度是什么意思?We can find the mean of a sample using the following formula:
::我们可以使用以下公式找到样本的平均值:¯ x = 𝛴 x n
::xxn 来In other words, we need to add all of the data values and divide the sum by the number of values. Recall that the Σ symbol means to add all of the values in the data set according to the expression that follows. The variable x represents the values in the sample, so Σ x means to add all the values in the sample.
::换句话说,我们需要添加所有的数据值,并将总和除以值数。 回顾 符号意味着根据以下表达式在数据集中添加所有值。 变量 x 代表样本中的值, 所以 x 表示在样本中添加所有值 。¯ x = 2.3 + 1.9 + 0.2 + 3.7 + 0.9 + 1.0 + 5.3 + 0.7 + 1.4 + 1.6 10 = 1.9
::x=2.3+1.9+1.9+0.2+3.7+0.9+1.0+5.3+0.7+1.4+1.610=1.9Answer: The average nitrate level of the 10 readings in the sample is 1.9 mg/L.
::答复:样本中10个读数的平均硝酸盐水平为1.9毫克/升。When finding the variance of a sample, we use a slightly different formula than the population variance formula. Rather than dividing by the number of data values, we divide by one less than the number of samples, or n − 1. Additionally, to represent the variance of a sample, we use the symbol s ² instead of 𝜎 ² , which we use to identify the population variance.
::在发现抽样的差异时,我们使用的公式与人口差异公式略有不同。我们不是除以数据值,而是除以数据值,而是除以样品数,或n-1。此外,为了代表抽样的差异,我们使用符号S2, 而不是用来确定人口差异的秒数。s ² = 𝛴 ( x − ¯ x ) ² n − 1
:x-x)2n-1) (x-x)2n-1)
It then follows suit that the symbol for standard deviation is s , and the formula is the square root of the variance formula.
::然后,标准偏离的符号是 s,而公式是差异公式的平方根。s = √ 𝛴 ( x − ¯ x ) ² n − 1
:Example
::示例示例示例示例Find the of the groundwater sample:
::查找地下水样本:2.3 , 1.9 , 0.2 , 3.7 , 0.9 , 1.0 , 5.3 , 0.7 , 1.4 , 1.6
Use the following formula to find the variance:
::使用下列公式查找差异:s ² = 𝛴 ( x − ¯ x ) ² n − 1
:Begin by finding the square of the difference between each value in the sample and the mean, or ( x − x ̄ ) 2 . We will then need to add these, as indicated by the ∑ symbol.
::首先找到样本中每个值与平均值或(x-xxx) 2 之间的差数的正方形。 然后我们需要按照 的符号来添加这些值。Once the values in the table above are added, divide them by n − 1.
::加上上表中的数值后,再除以 n-1。s ² = 𝛴 ( x − ¯ x ) ² n − 1 = 0.16 + 0 + 2.89 + 3.24 + 1 + 0.81 + 11.56 + 1.44 + 0.25 + 0.09 10 − 1 = 21.44 9 = 2.38 ¯ 2
::s2(x- =xx) 2n - 1=0. 16+0 2. 89+3. 24+1+0. 81+11. 56+1.44+0. 44+0. 25+0.0910=1=21.449=2.382The standard deviation is found by taking the square root of the variance.
::标准偏差通过从差异的平方根中找出。√ 2.38 ¯ 2 ≈ 1.54
Answer: The variance and standard deviation of the sample are approximately 2.38 and 1.54, respectively
::答复:抽样的差异和标准差分别约为2.38和1.54,Discussion Questions:
::讨论问题:-
Based on the last question in the inline question set above, since the two data sets have the same mean, what does it mean that the standard deviations are quite different in the context of the problem?
::根据上文内含问题中的最后一个问题,由于两个数据集的平均值相同,那么标准偏差在问题的背景中有很大不同意味着什么? -
Which brand would be a better choice for painting your house? Why?
::哪个品牌更适合画你的房子?
Summary -
A
survey
is the collection of data from a segment of the population to make inferences about the characteristics of the population as a whole.
::一项调查是从部分人口收集数据,以推断整个人口的特点。 -
A
population
is a group of objects with a common characteristic.
::一个种群是具有共同特征的一组物体。 -
A
sample
is the group selected from the population. The types of sampling are: simple random sample, cluster sample, stratified sampling, systematic sampling, and convenience sampling.
::抽样是从人口中选出的一组,抽样类型是:简单随机抽样、集群抽样、分层抽样、系统抽样和方便抽样。 -
Find the
mean
of a sample by summing all the values in the sample and then dividing the number of values.
::通过对样本中的所有值进行汇总,然后将数值数除以,来查找样本的平均值。 -
Find the
variance
of a sample using:
s
2
=
σ
(
x
−
¯
x
)
2
n
−
1
::使用 s2\\\\\\\\\\\\\\\\\\\\\\\\\\\\\\\\\\\\\\\\\\\\\\\\\\\\\\\\\\\\\\\\\\\\\\\\\\\\\\-\\\\\\\\\\\\\\\\\\\\\\\\\\\\\\\\\\\\\\\\\\\\\\\\\\\\\\\\\\\\\\\\\\\\\\\\\\\\\\\\\\\\\\\\\\\\\\\\\\\1\\\\\\\\ -
Find the
standard deviation
of a sample using:
s
=
√
σ
(
x
−
¯
x
)
2
n
−
1
::查找样本的标准偏差, 使用 : s( x- ’ x) 2n- 1
Wrap-Up: Review Questions
::总结:审查问题 -
Understand
statistics
as a process for making inferences about
population
parameters based on a
random sample
from that population.