2.15显示数据随时间变化的折线图
章节大纲
-

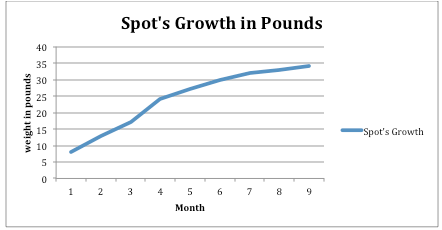
Jane is tracking her dog's weight as he grows from a puppy to an adult dog. Each month, she weighs Spot to see how much weight he has gained until he is 9 months old, when he is supposed to be fully grown. Ultimately, she wants to know how much weight Spot has gained from when he was a puppy to when he was fully grown.
::Jane在跟踪狗从小狗长到成年狗的体重,每个月,她都会称Spot,看他到9个月大之前的体重。最后,她想知道Spot从小狗长大到成年的体重增加了多少。Here is the data she collected on her notepad:
::以下是她在笔记本上收集的数据:1 month- 8 lb.
::1个月8磅2 months- 13 lb.
::2个月13磅3 months- 17 lb.
::3个月 - 17磅4 months- 24 lb.
::4个月 - 24磅5 months- 27 lb.
::5个月 - 27磅6 months- 30 lb.
::6个月 - 30磅7 months- 32 lb.
::7个月 - 32磅8 months- 33 lb.
::8个月33磅9 months- 34 lb.
::9个月 - 34磅Jane wants to graph this data so she can determine the difference between Spot's weight when he was a tiny puppy to when he was 9 months old.
::Jane想用图表显示这个数据 这样她就可以确定 Spot小时候的体重 与他9个月大时的体重的差别In this concept, you will learn how to create a line graph and analyze data displayed on a line graph.
::在此概念中, 您将学习如何创建线条图和分析显示在线条图上的数据 。Line Graphs
::直线图A line graph is a graph that shows how data changes over time.
::线条图是一个显示数据随时间变化的图表。To make a line graph, you need a collection of data that has changed over time. Data that shows growth over years is a good example of appropriate data for a line graph.
::要绘制直线图, 您需要收集随时间变化的数据。 显示年增长的数据是用于直线图的适当数据的一个很好的例子 。When Jamal was born, his parents planted a tree in the back yard. Here is how tall the tree was in each of the next five years.
::当Jamal出生时,他的父母在后院种植了棵树,这是这棵树在接下来的五年里每一棵树都有多高。2003- 2 ft.
::2003年 - 2英尺2004- 3 ft.
::2004年 3英尺2005- 5 ft.
::2005年 - 5英尺2006- 9 ft.
::2006年-9英尺2007- 14 ft.
::2007年 - 14英尺Like other graphs, line graphs need two axes, one vertical (Y-axis) and one horizontal (X-axis).
::与其他图表一样,直线图需要两个轴,一个垂直轴(Y轴),一个水平轴(X轴)。The vertical axis represents the range of tree growth. The tree grew from 2 feet to 14 feet. That is the scale. The horizontal axis represents the years when tree growth was calculated.
::垂直轴代表着树生长的范围。 树从2英尺长到14英尺。 这就是比例。 水平轴代表着树生长的年份。Here is a finished line graph representing this data:
::这是此数据所显示的完成行图 :It is important to know how to create line graphs for the purpose of reading and analyzing the data displayed in the graph. Patterns and trends can be concluded by reading line graphs to answer questions. In the Guided Practice section, you will be practicing answer specific questions related to a new set of data.
::重要的是要知道如何为阅读和分析图表中显示的数据而创建线条图。 模式和趋势可以通过阅读线条图解来结束, 回答问题。 在“ 指导实践” 部分, 您将练习解答与新数据集有关的具体问题 。Examples
::实例Example 1
::例1Earlier, you were given a problem about Jane and Spot.
::早些时候,你得到一个问题 关于简和斑点。Jane wanted to track Spot's growth from 1 month old to 9 months old. She kept track of his weight gain and recorded the following data:
::Jane想追踪Spot从1个月大到9个月大的成长。1 month- 8 lb.
::1个月8磅2 months- 13 lb.
::2个月13磅3 months- 17 lb.
::3个月 - 17磅4 months- 24 lb.
::4个月 - 24磅5 months- 27 lb.
::5个月 - 27磅6 months- 30 lb.
::6个月 - 30磅7 months- 32 lb.
::7个月 - 32磅8 months- 33 lb.
::8个月33磅9 months- 34 lb.
::9个月 - 34磅Jane wants to graph this data and then figure out Spot's total weight gain from 1 month to 9 months.
::Jane想用图表显示这个数据 然后找出Spot的总重量从1个月至9个月的总重量增加。First, Jane creates her line graph. She creates an x axis to represent months and a y axis to represent weight in pounds. She plots her points on the graph and connects them to create a line in the graph.
::首先, Jane 创建她的线性图表。 她创建了 X 轴以代表月份, y 轴以以重量表示磅。 她绘制了图上的点数, 并将其连接起来, 在图中创建一条线 。Next, Jane begins to figure out the difference in weight from 1 month old to 9 months old. She looks for Spot's weight at 1 month first. His weight was about 8 lb.
::接下来,简开始发现体重的差别 从1个月大到9个月大。她首先在1个月的时候寻找Spot的体重。他的体重大约是8磅。Then, Jane finds the data showing his weight at 9 months old. Spot weighs about 34 lb. now.
::然后Jane发现9个月大时体重的数据 点重约34磅To find the total weight gain, Jane finds the difference between these two data points by subtracting.
::为了找到总重量增量,Jane通过减法发现这两个数据点之间的差异。The answer is Spot gained a total of 26 pounds from when he was a puppy until he was fully grown at 9 months.
::答案是Spot从小狗时 总共获得26磅 直至9个月完全长大Example 2
::例2Consider the following line graph.
::考虑下行图。Which day of the week had the highest temperature? What was that temperature?
::这周哪天的温度最高?First, analyze the graph to find the highest point in the trend line.
::首先,分析图表以找到趋势线的最高点。Next, follow down to the X-axis from that highest point to see what time that data represents. The highest point in this graph is data from February 3rd.
::接下来,从那个最高点向下到 X 轴, 看看数据代表的时间。 本图中的最高点是 2月3日的数据 。Then, go back to the highest point and follow across to the Y-axis for the value that is represented by that point on the graph. This point falls between 30 and 35 degrees somewhere in the middle. So a good estimate is about 33 degrees.
::然后,回到最高点,然后到Y轴,以图中该点所代表值为准。这个点在中间大约30至35度之间。因此,一个良好的估计值是大约33度。The answer is February 3rd. The temperature on that day was about 33 degrees.
::答案是2月3日 那天的温度大约是33度Use the data from the graph "This Week's Temperatures in Boston" to answer the following questions.
::使用“波士顿本周温度”图中的数据回答下列问题。Example 3
::例3What was the temperature in Boston on February 1st?
::2月1日波士顿的气温是多少?First, find the data for February 1st on the X-axis.
::首先,在X轴上找到2月1日的数据。Next, follow up the graph to the data point for that day.
::接下来,追踪图表到当天的数据点。Then, follow across to the Y-axis to determine the temperature on that day. Some estimating may be necessary if the point does not fall directly on a number but more in between two data ranges.
::然后,顺着Y轴去决定当日的温度。如果点不是直接落在数字上,而是在两个数据范围之间,则可能需要做一些估计。The answer is about 27 degrees.
::答案大约是27度Example 4
::例4What day that week had the lowest temperature in Boston?
::那周哪天的温度是波士顿最低的?First, look at the line in the graph to find the lowest data point on the line. In this case, there are two low points that seem to be the same temperature.
::首先, 查看图中的线以找到线上的最小数据点。 在此情况下, 有两个低点, 似乎是相同的温度 。Next, follow down to the X-axis to determine the day the lowest point occurred.
::接下来,接着到X轴,确定最低点的发生日期。Then, do the same with the other low point in the line to see the other day that had the same low temperature.
::然后,对线上的其他低点也做同样的操作 来观察前几天的温度 同样的低点。The answer is that both February 5th and February 6th had the lowest temperature that week.
::答案是,2月5日和2月6日 的温度都是最低的Example 5
::例5What is the greatest difference in temperature in Boston that week?
::那周波士顿的气温有什么最大的差别?First, gather the data for the highest temperature that week. The high temperature was about 33 degrees on February 3rd.
::首先,收集该周最高温度的数据。2月3日的高温约为33度。Next, gather the data for the lowest temperature that week so you can find the difference. The lowest temperature that week was about 26 degrees on two different days (February 5th and 6th).
::接下来,收集该周最低温度的数据,以便找到差数。该周的最低温度是两个不同天(2月5日和6日)的26摄氏度左右。Then, find the difference between the high and low temperatures that week by subtracting.
::然后,通过减去来发现高温和低温之间的差别。The answer is there was a difference of 7 degrees.
::答案是差7度。Review
::回顾Use the following line graph to answer each question.
::使用下线图回答每个问题。-
What is being measured in this line graph?
::该行图中测量的是什么? -
What is on the horizontal axis?
::水平轴上是什么? -
What is on the vertical axis?
::垂直轴上是什么? -
What was the highest temperature recorded?
::记录的最高温度是多少? -
What was the lowest temperature recorded?
::记录的最低温度是多少? -
What is the difference between the two temperatures?
::两种温度有什么区别? -
On what day did the lowest temperature occur?
::最低温度是在哪一天发生的? -
What was the average temperature for the week?
::这个星期的平均温度是多少? -
Did any two days have the same temperature?
::任何两天的温度都是一样的吗? -
What was that temperature?
::温度是多少? -
On which two days did it occur?
::发生在哪两天? -
Based on this trend, would the temperature on February 8th be less than 30 degrees or greater than?
::根据这一趋势,2月8日的温度是否低于30度或高于30度? -
True or false. There isn't a way to figure out the temperature on January 31st.
::没有办法在1月31日找到温度 -
What was the temperature on February 5th?
::2月5日的温度是多少?
-
What is being measured in this line graph?