6.17盒须图
章节大纲
-
Mr. Wilson created a box-and-whisker plot with the test scores from the most recent math test. Identify the , quartiles, and extremes . What can you infer from the box-and-whisker plot?
::威尔逊先生用最近数学测试的评分 创造了一个盒子和口语的图案。 识别了四分位数和极端数。 你能从盒子和口语的图案中推断出什么?In this concept, you will learn how to draw a box-and-whisker plot from a set of data .
::在这个概念中,你将学会如何从一组数据中绘制一个纸箱和纸笔图。Box-and-Whisker Plots
::插盒和口述口语笔A box-and-whisker plot or box plot is a graph that represents the distribution of a data set . The key parts needed to draw a box-and-whisker plot are:
::框式和框式图案或框式图案是代表数据集分布的图表。要绘制框式和框式图案,关键部分是:-
Median
- the middle number of a data set that is ordered from least to greatest.
::中位数 - 一组数据集的中位数, 该数据集从最少订购到最多订购 。 -
Lower
and
upper
quartiles
- values that divide the data set into four sections
::下层和上层孔径 - 将数据集分成四部分的数值 -
Lower
and
upper
extremes
- the smallest and largest values in the data set.
::下层和上层外层 -- -- 数据集中最小和最大的值。
Here is the data set from a survey of the number of hours worked by teenagers with part-time jobs.
::以下是非全日工作青少年工作时间调查的一组数据。6, 8, 8, 8, 10, 10, 11, 11, 12, 15, 16, 16, 20
The median is 11. The lower quartile is 8 and the upper quartile is 15.5. The lower extreme is 6 and the upper extreme is 20.
::中位数为11, 下四分位数为8, 上四分位数为15.5, 下四分位数为6, 上四分位数为20。Here are the steps to drawing a box-and-whisker plot:
::以下是绘制纸箱和口哨图的步骤:-
Draw a number line labeled to show the
range
of data from least to greatest.
::绘制标注的数字行,以显示从最小到最大的数据范围。 -
Identify the median, the upper quartile, the lower quartile, the lower extreme and the upper extreme on the number line.
::识别中位数、上四分位数、下四分位数、下极端数和数字线上的上端极数。 -
Draw in a box around the quartiles. The median is the middle line of the two boxes.
::在四面形周围的框中绘制。中位数是两个框的中间线。 -
Then draw in the whiskers. These are lines that extend from each
quartile
to the upper and lower extremes.
::然后画出胡须。这些是从每个四分位到上层和下层极端的线条。
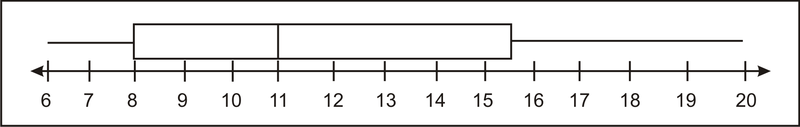
Here is a picture of a number line with a completed box-and-whisker plot on it.
::这是一张数字行的图片,上面有一张填好的纸箱和口哨图。The first box goes from the lower quartile 8 to the median 11. The second box goes from the median 11 to the upper quartile 15.5. The whiskers extend out from the lower quartile to the lower extreme of 6, and from the upper quartile to the upper extreme of 20.
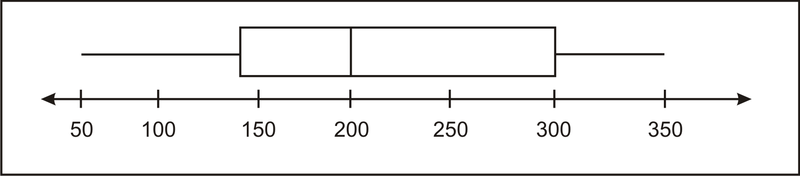
::第一个盒子从下四分位数8到中位数11,第二个盒子从中位数11到上四分位数15.5,胡须从下四分位数到下端点6,从上四分位数到上端点20。Now that you know how to draw a box-and-whisker plot using measure of data, you can look at a box-and-whisker plot and identify the median, quartiles and extremes. Look at the box-and-whisker plot below.
::现在,你知道如何用数据量度来绘制一个盒子和口语图, 您可以查看一个盒子和口语图, 并辨别中位数、 四分位数和极端数。 看看下面的盒子和口语图 。Use this chart to examine the data. The median divides the two boxes. The median here is 200. The lower quartile is 100 and the upper quartile is 300. The lower extreme is 50 and the upper extreme is 400. The wider the quartile range, the more varied the data set.
::使用此图表来检查数据。 中位数将两个框分隔开来。 这里的中位数为200。 下四分位数为100, 上四分位数为300。 下四分位数为50, 上四分位数为400。 四分位数范围越大, 数据集越多。You can compare two sets of data using box-and-whisker plots.
::您可以使用纸箱和耳机图比较两组数据。These box-and-whisker plots show the number of miles James and Angie ran per day in a month.
::詹姆斯和安琪一个月里每天跑多少英里James and Angie ran a similar range of miles. James ran between 2 and 17 miles a day. Angie ran between 2 and 15 miles.
::James和Angie的距离也差不多,James的距离是每天2至17英里,Angie的距离是2至15英里。The width of the quartile boxes tells you that James more varied distances than Angie. James ran between 4 to 10 miles. Angie ran between 9 to 12 miles on most days. Also, look at size of each quartile box. Notice that the box to the left of Jame's median is smaller than the box to the right of the median. This tells you that James ran fewer than 5 miles more often. Angie ran more than 11 miles more often.
::四个圆形箱的宽度告诉你,詹姆斯的距离比安琪要远。詹姆斯跑4到10英里。安琪在大多数天里跑9到12英里。 另外,看看每个圆形箱的大小。注意Jame的中位值左边的盒子小于中位值右边的盒子。这说明James跑不到5英里。安琪经常跑超过11英里。Examples
::实例Example 1
::例1Earlier, you were given a problem about Mr. Wilson's box-and-whisker plot.
::早些时候,你得到一个问题 关于威尔逊先生的 盒子和口哨阴谋。Mr. Wilson created a box-and-whisker plot with the test scores from the most recent math test. Identify the median, quartiles, and extremes. What can you infer from the box-and-whisker plot?
::Wilson先生用最近数学测试的评分创造了一个盒子和口语图。 确定中位数、 四分位数和极端数。 您可以从纸箱和口语图中推断出什么?The median is 85. The lower quartile is around 79 and the upper quartile is around 83. The lower extreme is around 68 and the upper extreme is around 93.
::中位数为85. 下四分位数约为79,上四分位数约为83,下位数约为68,上位数约为93。You can infer that the lowest grade was a 68 and the highest grade was a 98. The quartile boxes are not too far from the median, so you can also infer that the average for the class is probably a B.
::可以推断,最低年级为68,最高年级为98,四分位框离中位数不远,因此也可以推断,该班的平均数可能是B。Example 2
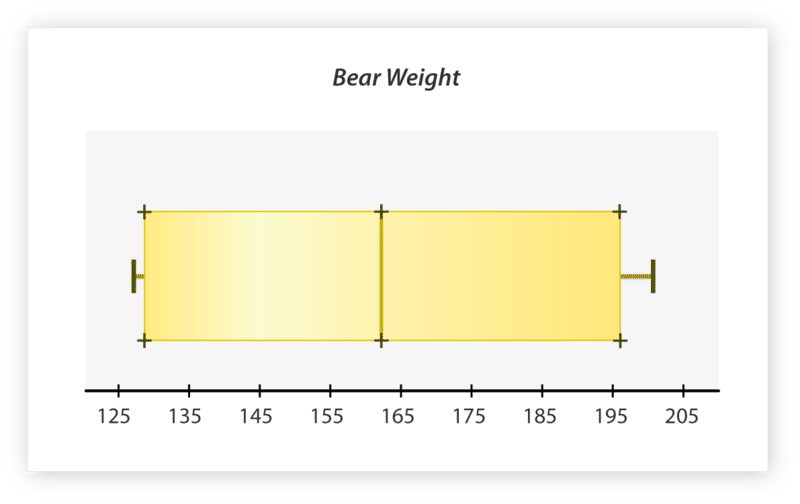
::例2The weight of bears varies between species. Weight also varies within species as a result of habitat and diet. The box-and-whisker plot was created after recording the weight (in pounds) of several black bears across the country.
::熊的重量因物种而异,由于栖息地和饮食原因,不同物种的重量也不同。 盒式和口述图是在记录了全国若干黑熊的重量(磅)之后产生的。Use the box-and-whisker plot to answer the questions below.
::使用纸箱和私语图解答下面的问题。What are the highest and lowest weights represented on the box-and-whisker plot?
::盒子和口哨地块上最高和最低的重量代表什么?The lowest value or weight is 127 pounds. The highest value or weight is 201 pounds.
::最低价值或重量为127磅,最高价值或重量为201磅。What is the median weight for a black bear?
::黑熊的中位体重是多少?The median weight is 163 pounds.
::中位体重为163磅。What is an observation you can make about the weight of the black bears in this survey?
::你对黑熊的重量有什么看法?It appears that there are a lot of bears on the high and low end of the spectrum.
::光谱的高端和低端似乎有许多熊。Answer the following questions using this box-and-whisker plot.
::使用这个纸箱和口哨图解答下列问题。Example 3
::例3What is the smallest value on the plot?
::地块上最小值是多少?The lower extreme is 34 .
::较低的极端是34。Example 4
::例4What is the greatest value on the plot?
::这块地上最大的价值是什么?The upper extreme is 58.
::顶端是58Example 5
::例5What is the median of the whole data set?
::整个数据集的中位数是多少?The median is 49.
::中位数为49。Review
::回顾Use the box-and-whisker plot to answer the following questions.
::使用纸箱和私语图解答下列问题。-
What is the median score in this box-and-whisker plot?
::这个盒子和口哨图的中位分数是多少? -
What is the lower quartile?
::什么是低四分位数? -
What is the upper quartile?
::上四分位体是什么? -
What is the range of the data?
::数据的范围是什么? -
What is the lower extreme?
::什么是低端极端? -
What is the upper extreme?
::什么是最极端的?
Use the data to answer the following questions.
::使用数据回答下列问题。25, 26, 30, 18, 24, 26, 19, 21, 22
-
Draw a box-and-whisker plot.
::绘制一个盒子和口令的图案。 -
Write the data in order from least to greatest.
::将数据从最少写到最多。 -
What is the median score?
::中位分数是多少? -
What is the lower quartile?
::什么是低四分位数? -
What is the upper quartile?
::上四分位体是什么? -
What is the lower extreme?
::什么是低端极端? -
What is the upper extreme?
::什么是最极端的? -
What is the range of the data?
::数据的范围是什么?
Review (Answers)
::回顾(答复)Click to see the answer key or go to the Table of Contents and click on the Answer Key under the 'Other Versions' option.
::单击可查看答题键, 或转到目录中, 单击“ 其他版本” 选项下的答题键 。Resources
::资源
-
Median
- the middle number of a data set that is ordered from least to greatest.