8.13圆图的解释
章节大纲
-
Monica is opening a restaurant. She wants to offer at least two kinds of ice cream flavors for dessert. She uses a data collection company to find out what flavors people prefer. The company uses this circle graph to show the results of the survey . Of the four flavors, which two flavors would most people prefer?
::Monica正在开一家餐馆。 她想提供至少两种冰淇淋口味的甜点。 她利用一家数据收集公司来寻找人们喜欢的口味。 该公司用这个圆形图来显示调查的结果。 在四种口味中,大多数人喜欢哪种口味?In this concept, you will learn how to interpret circle graphs.
::在这个概念中,你会学习如何解释圆形图。Interpreting Circle Graphs
::解释圆形图A circle graph is a visual way of displaying data that is written in percents. The circle represents 100%. The circle is divided into sections. Each section shows what part of 100 that item represents. The circle graph uses different colors for each category being described. The legend on the right shows what each color corresponds to.
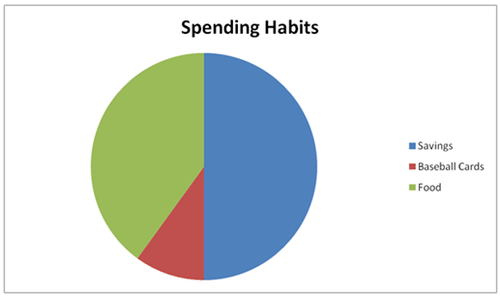
::圆形图是显示以%表示的数据的直观方式。圆形为100%。圆形为100%。圆形分为几个部分。每一部分显示100项中哪一部分。圆形图对所描述的类别使用不同的颜色。右侧图例显示每个颜色对应的颜色。This circle graph describes a student’s spending habits.Each color represents what his money is spent on. Blue is savings, red is baseball cards, and green is food. By looking at this graph, you may determine that this student saves half (or 50%) of all his money. He spends a smaller fraction on baseball cards and the rest on food.
::这个圆形图描述了学生的消费习惯。 每个颜色代表着他所花的钱。 蓝色代表储蓄,红色代表棒球卡,绿色代表食物。 通过查看这个图,您可以确定这位学生节约了一半(或50 % ) 。 他花在棒球卡上的钱少了一小部分,其余的则花在食物上。Notice that all three percents add up to 100%. A circle graph shows information out of 100.
::注意所有 3% 的加起来都等于 100% 。 一个圆形图显示100 中的信息 。Examples
::实例Example 1
::例1Earlier, you were given a problem about Monica and her ice cream flavors.
::之前,你得到一个问题 关于莫妮卡和她的冰淇淋口味。Monica needs to pick two flavors that would satisfy the most people. Monica needs to use the circle graph to make her decision.
::Monica需要用圆形图来做决定First, Monica needs to find the two flavors with biggest section or the largest percents.
::首先,莫妮卡需要找到两种口味 最大的部分或最大的百分比。She sees that the red and blue sections make up most of the circle graph.
::她看到红色和蓝色部分 占圆形图的大部分Then, she looks at the legend to see what the colors represent.
::然后,她看着传奇 看看颜色代表什么Red represents chocolate and blue represents vanilla.
::红色代表巧克力 蓝色代表香草Monica should pick chocolate and vanilla to satisfy the most people.
::莫妮卡应该选巧克力和香草 来满足大多数人Example 2
::例2Use the circle graph to answer the questions.
::使用圆形图回答问题。Based on this graph, which foreign language is the most popular?
::根据这个图表,哪一种外语最受欢迎?First, look at the circle graph. Find the largest wedge. The percent is also written each wedge.
::首先,看看圆形图。 找到最大的边框。 百分比也是每个边框写的 。The pink wedge with 55% is the largest wedge.
::55%的粉红网是最大的网状网状网状网状网状网状网状网状网状网状网状网状网状网状网状网状网状网状网状网状网状网状网状网状网状网状网状网状网状网状网状网状网状网状网状网状网状网状网状网状网状网状网状网状网状网状网状网状网状网状网状网状网状网状网状网状网状网状网状网状网状网状网状网状网状网状网状网状网状网状网状网状网状网状网状网状网状网状网状网状网状网状网状网状网状网状网状网状网状网状网状网状网状网状网状网状网状网状网状网状网状网状网状网状网状网状网状网状网状网状网状网状网状。Then, look at the legend to find what language pink represents.
::然后,看看传说 找到什么语言的粉红色代表。Pink represents Spanish.
::粉色代表西班牙语。Spanish has the largest percent, 55%. This means 55% of all the students have studied Spanish.
::西班牙人的比例最大,占55%,这意味着所有学生中有55%学习过西班牙语。Spanish is the most popular foreign language studied.
::西班牙语是研究中最受欢迎的外语。Example 3
::例3Looking at the graph above, about what percent is not spent on saving?
::上面的图表显示, 哪些百分比没有花在储蓄上?First, look at the wedge that represents savings.
::首先,看看代表储蓄的支点。The blue wedge represents the amount spent on savings.
::蓝色边框代表节省的金额。Then, determine about how much of the total is spent on savings.
::然后,确定总开支中有多少用于储蓄。The blue wedge takes up about half or 50% of the circle.
::蓝边占了半个或50%的圆圈Example 4
::例4True or false: the following percents could be part of one circle graph: 25%, 10%, and 65%.
::真实或虚假:以下百分比可以是一个圆形图的一部分:25%、10%和65%。First, add the given percents.
::首先,加上给定百分比。A circle graph represents 100%.
::一个圆形图代表100%。True, 25%, 10% and 65% can be part of one circle graph.
::确实,25%,10%和65%可以作为一个圆形图的一部分。Example 5
::例5True or false: the following percents could be part of the same circle graph: 35%, 70%, and 5%.
::真实或虚假:以下百分比可以是同一圆形图的一部分:35%、70%和5%。First, add the given percents.
::首先,加上给定百分比。35% + 70% + 5% = 110%
A circle graph cannot be more than 100%.
::圆形图不能超过100%。False, 35%, 70% and 5% cannot be part of the same circle graph.
::假的、35%、70%和5%不能成为同一圆形图的一部分。Review
::回顾Use the circle graph to answer the following questions.
::使用圆形图回答下列问题。-
Which foreign language is the least popular?
::哪一种外语最不受欢迎? -
If 30% of the students chose French, what percent did not choose French?
::如果30%的学生选择了法语,那么,什么比例没有选择法语? -
What percent of the students chose Italian?
::有多少学生选择意大利语? -
What percent of the students did not chose Italian?
::有多少学生没有选择意大利语? -
What percent of the students chose Latin?
::有多少学生选择拉丁语? -
What percent of the students did not choose Latin or French?
::有多少学生没有选择拉丁或法语? -
What percent of the students did not choose French or Spanish?
::有多少学生没有选择法语或西班牙语? -
What percent of the students did not choose German?
::有多少学生没有选择德语?
-
What percent of Patrick’s budget is spent of transportation?
::Patrick预算的多少百分比用于交通? -
What percent of the budget is spent on food?
::用于食品的预算占多少比例? -
What percent of the budget is not spent on food or savings?
::预算的多少百分比没有用于食品或储蓄? -
If 35% of the budget is spent on rent and utilities, what percent is not spent on this?
::如果35%的预算用在租金和水电费上,那么什么百分比不用在租金和水电费上? -
True or false. Patrick does not spend any money on clothing.
::Patrick不会花任何钱买衣服 -
What percent is spent on savings and food together?
::储蓄和食物一起花费了多少百分比? -
If Patrick was going to increase his savings by 15% what would the new percent of savings be?
::如果Patrick打算将储蓄增加15%,
Review (Answers)
::回顾(答复)Click to see the answer key or go to the Table of Contents and click on the Answer Key under the 'Other Versions' option.
::单击可查看答题键, 或转到目录中, 单击“ 其他版本” 选项下的答题键 。Resources
::资源
-
Which foreign language is the least popular?