机器学习
k-均值聚类算法
K-均值(k-means) 是最常用的聚类算法之一。它允许根据数据之间存在的相似性,将数据分组到 k 个簇中(k 作为算法的输入)。我将从一个简单的例子开始。
假设我们有 5 个对象(比如 5 个人),并且我们知道他们各自的两个特征(身高和体重)。我们想将他们分组到 k=2 个簇中。
我们的数据集将如下所示:
| 对象 | 身高(厘米) | 体重(公斤) |
| Person 1 | 167 | 55 |
| Person 2 | 120 | 32 |
| Person 3 | 113 | 33 |
| Person 4 | 175 | 76 |
| Person 5 | 108 | 25 |
首先,我们必须为簇初始化质心。例如,我们选择 Person 2 和 Person 3 作为两个质心 c1 和 c2,所以 ,。
现在我们计算每个质心与数据中每个点之间的欧几里得距离。
如果你完成了所有计算,你应该会得到以下数字:
| 对象 | 距 c1 的距离 | 距 c2 的距离 |
| Person 1 | 52.3 | 58.3 |
| Person 2 | 0 | 7.1 |
| Person 3 | 7.1 | 0 |
| Person 4 | 70.4 | 75.4 |
| Person 5 | 13.9 | 9.4 |
此时,我们将每个对象分配到离它最近的簇(即为每个对象取两个计算距离中的最小值)。
我们可以将点安排如下:
- Person 1 → 簇 1
- Person 2 → 簇 1
- Person 3 → 簇 2
- Person 4 → 簇 1
- Person 5 → 簇 2
接下来,我们进行迭代,这意味着通过计算每个簇成员的均值来重新定义质心。
所以,c1′=((167+120+175)/3,(55+32+76)/3)=(154,54.3)
和 c2′=((113+108)/2,(33+25)/2)=(110.5,29)
然后,我们再次计算距离,并将点重新分配给新的质心。
我们重复这个过程,直到质心不再移动(或者它们之间的差异小于某个小的阈值)。
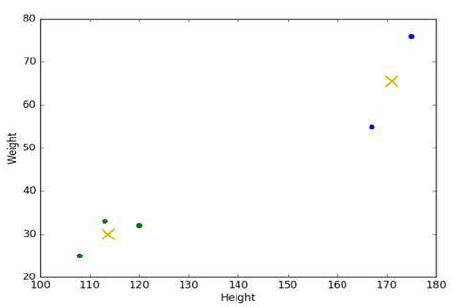
在我们的例子中,得到的结果如下图所示。您可以看到用两种不同颜色标记的两个不同簇以及用叉表示的质心位置。
如何应用 k-均值?
正如您可能已经知道的,我使用 Python 库来分析我的数据。k-均值算法在 scikit-learn 包中实现。要使用它,您只需在脚本中添加以下一行:
from sklearn.cluster import KMeans
如果我们的数据是...非数值型怎么办?
此时,您可能会注意到一些问题。k-均值的基本概念建立在数学计算(均值、欧几里得距离)之上。但是,如果我们的数据是非数值的,换句话说,是类别型的呢?例如,想象一下,上一个例子中的五个人,我们知道的是他们的身份证号码和出生日期,而不是身高和体重。
我们可能会考虑将类别值转换为数值,然后应用 k-均值。但请注意:k-均值使用数值距离,因此它可能会将两个实际距离很远但仅仅被分配了两个相近数字的对象视为“接近”。
k-众数(k-modes) 是 k-均值的一个扩展。它不使用距离,而是使用相异度(即,量化两个对象之间不匹配的总数:这个数字越小,两个对象越相似)。它也不使用均值,而是使用众数(modes)。众数是一个元素向量,它使向量本身与数据中每个对象之间的相异度最小化。我们将有与所需簇数一样多的众数,因为它们充当质心。
k-means clustering algorithm
One of the most used clustering algorithm is k-means. It allows to group the data according to the
existing similarities among them in k clusters, given as input to the algorithm. I’ll start with a simple
example.
Let’s imagine we have 5 objects (say 5 people) and for each of them we know two features (height and
weight). We want to group them into k=2 clusters.
Our dataset will look like this:
First of all, we have to initialize the value of the centroids for our clusters. For instance, let’s choose
Person 2 and Person 3 as the two centroids c1 and c2, so that c1=(120,32) and c2=(113,33).
Now we compute the euclidian distance between each of the two centroids and each point in the data.
If you did all the calculations, you should have come up with the following numbers:
PersonPersonPersonPersonPerson1
2
3
4
5
Distance of object from c1
52.3
0
7.1
70.4
13.9
Distance of object from c2
58.3
7.1
0
75.4
9.4
At this point, we will assign each object to the cluster it is closer to (that is taking the minimum between
the two computed distances for each object).
We can then arrange the points as follows:
Person 1 → cluster 1
Person 2 → cluster 1
Person 3 → cluster 2
Person 4 → cluster 1
Person 5→ cluster 2
Let’s iterate, which means to redefine the centroids by calculating the mean of the members of each of
the two clusters.
So c’1 = ((167+120+175)/3, (55+32+76)/3) = (154, 54.3) and c’2 = ((113+108)/2, (33+25)/2) = (110.5, 29)
Then, we calculate the distances again and re-assign the points to the new centroids.
We repeat this process until the centroids don’t move anymore (or the difference between them is
under a certain small threshold).
In our case, the result we get is given in the figure below. You can see the two different clusters labelled
with two different colours and the position of the centroids, given by the crosses.
57
How to apply k-means?
As you probably already know, I’m using Python libraries to analyze my data. The k-means algorithm is
implemented in the scikit-learn package. To use it, you will just need the following line in your script:
What if our data is... non-numerical?
At this point, you will maybe have noticed something. The basic concept of k-means stands on
mathematical calculations (means, euclidian distances). But what if our data is non-numerical or, in
other words, categorical? Imagine, for instance, to have the ID code and date of birth of the five people
of the previous example, instead of their heights and weights.
We could think of transforming our categorical values in numerical values and eventually apply k-
means. But beware: k-means uses numerical distances, so it could consider close two really distant
objects that merely have been assigned two close numbers.
k-modes is an extension of k-means. Instead of distances it uses dissimilarities (that is,
quantification of the total mismatches between two objects: the smaller this number, the more similar
the two objects). And instead of means, it uses modes. A mode is a vector of elements that minimizes
the dissimilarities between the vector itself and each object of the data. We will have as many modes as
the number of clusters we required, since they act as centroids.