机器学习
-
设想我们从分布 D 中抽取一个包含 n 个独立实例的随机样本 S,然后测量其样本误差 errors(h)。如果我们将这个实验重复多次,每次都抽取一个大小为 n 的不同随机样本 Si,我们预期会观察到不同的 errorsi(h) 值,这取决于不同 Si 构成中的随机差异。我们称 errorsi(h)(第 i 次此类实验的结果)为一个随机变量。
-
假设我们进行 k 次随机实验,测量随机变量 errors1(h),errors2(h),…,errorsk(h),并绘制一个直方图,显示每个可能的误差值被观察到的频率。
-
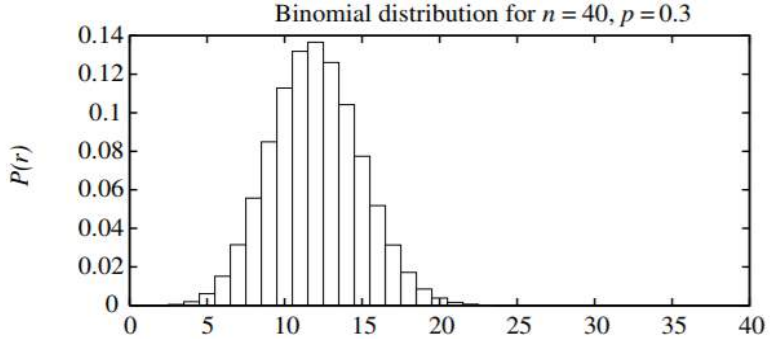
随着 k 值的增长,这个直方图将趋近于一个特定的概率分布,称为二项式分布(Binomial distribution),如下图所示。
二项式分布由以下概率函数定义:
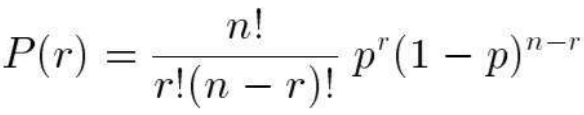
其中 p 是每次试验成功的概率,n 是试验总次数,r 是成功的次数, 是二项式系数。
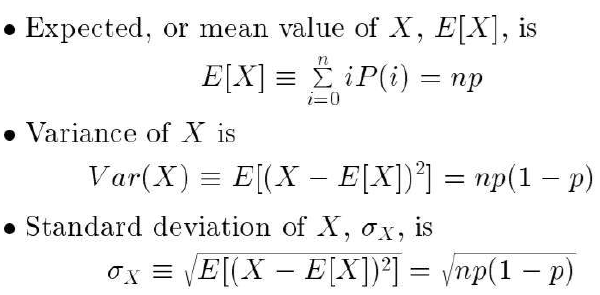
如果随机变量 X 服从二项式分布,那么:
- X 取值为 r 的概率 由 P(r) 给出。
Collect a random sample S of n independently drawn instances from the distribution D, and then
measure the sample error errors. Repeat this experiment many times, each time drawing a
different random sample Si of size n, we would expect to observe different values for the various
errorsi, depending on random differences in the makeup of the various Si. We say that errorsi
,
the outcome of the ith such experiment, is a random variable.
Imagine that we were to run k random experiments, measuring the random variables errors1,
errors2 . . . errorssk
and plotted a histogram displaying the frequency with which each
possible error value is observed.
As k grows, the histogram would approach a particular probability distribution called the Binomial
distribution which is shown in below figure.
A Binomial distribution is defined by the probability function
If the random variable X follows a Binomial distribution, then:
The probability Pr(X = r) that X will take on the value r is given by P(r)