Python 机器学习
回归简介
回归是另一种重要且广泛使用的统计和机器学习工具。基于回归的任务的关键目标是针对给定的输入数据预测连续数值的输出标签或响应。输出将基于模型在训练阶段学到的内容。基本上,回归模型利用输入数据特征(自变量)及其对应的连续数值输出值(因变量或结果变量)来学习输入与相应输出之间的特定关联。
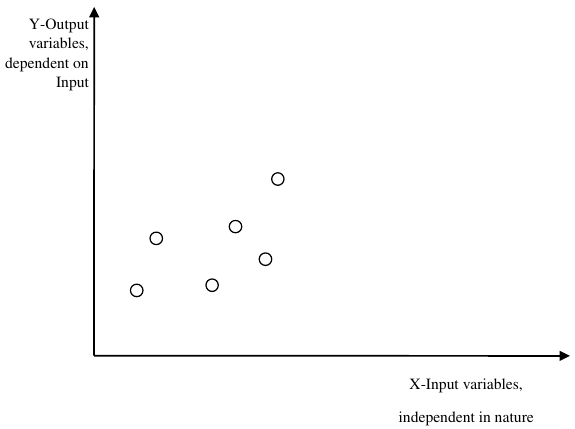
Y - 输出变量,依赖于输入
X - 输入变量,本质上是独立的
回归模型的类型
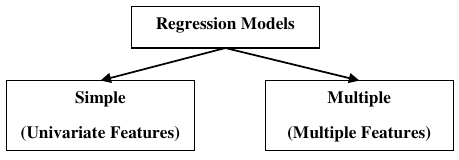
回归模型
- 简单回归 (单变量特征)
- 多元回归 (多变量特征)
回归模型分为以下两种类型:
- 简单回归模型:这是最基本的回归模型,其中预测是从数据的单个单变量特征形成的。
- 多元回归模型:顾名思义,在此回归模型中,预测是从数据的多个特征形成的。
在 Python 中构建回归器
Python 中的回归器模型可以像我们构建分类器一样构建。Scikit-learn,一个用于机器学习的 Python 库,也可以用于在 Python 中构建回归器。
在下面的示例中,我们将构建基本回归模型,该模型将拟合一条线到数据,即线性回归器。在 Python 中构建回归器的必要步骤如下:
步骤 1:导入必要的 Python 包
为了使用 scikit-learn 构建回归器,我们需要导入它以及其他必要的包。我们可以使用以下脚本导入:
import numpy as np
from sklearn import linear_model
import sklearn.metrics as sm
import matplotlib.pyplot as plt
步骤 2:导入数据集
导入必要的包后,我们需要一个数据集来构建回归预测模型。我们可以从 sklearn 数据集导入,也可以根据我们的要求使用其他数据集。我们将使用我们保存的输入数据。我们可以借助以下脚本导入它:
input_file = r'C:\linear.txt' # 将 'input' 更改为 'input_file' 以避免与内置函数冲突

# 接下来,我们需要加载这些数据。我们使用 np.loadtxt 函数来加载它。
input_data = np.loadtxt(input_file, delimiter=',')
X, y = input_data[:, :-1], input_data[:, -1]
步骤 3:将数据组织成训练集和测试集
由于我们需要在未见过的数据上测试我们的模型,因此我们将数据集分为两部分:训练集和测试集。以下命令将执行此操作:
training_samples = int(0.6 * len(X))
# testing_samples = len(X) - num_training # 修正:num_training 应该使用 training_samples
# testing_samples = len(X) - training_samples # 实际上 testing_samples 不需要显式计算,因为可以直接切片

X_train, y_train = X[:training_samples], y[:training_samples]
X_test, y_test = X[training_samples:], y[training_samples:]
步骤 4:模型评估与预测
将数据分成训练集和测试集后,我们需要构建模型。我们将为此目的使用 Scikit-learn 的 LinearRegression() 函数。以下命令将创建一个线性回归器对象。
reg_linear = linear_model.LinearRegression()
接下来,使用训练样本训练此模型,如下所示:
reg_linear.fit(X_train, y_train)
现在,最后我们需要使用测试数据进行预测。
y_test_pred = reg_linear.predict(X_test)
步骤 5:绘图与可视化
预测后,我们可以借助以下脚本进行绘图和可视化:
plt.scatter(X_test, y_test, color='red')
plt.plot(X_test, y_test_pred, color='black', linewidth=2)
plt.xticks(())
plt.yticks(())
plt.show()
输出:
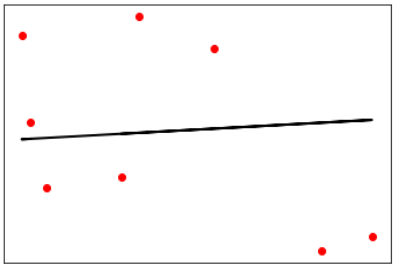
在上面的输出中,我们可以看到数据点之间的回归线。
步骤 6:性能计算
我们还可以借助各种性能指标计算回归模型的性能,如下所示:
print("Regressor model performance:")
print("Mean absolute error(MAE) =", round(sm.mean_absolute_error(y_test, y_test_pred), 2))
print("Mean squared error(MSE) =", round(sm.mean_squared_error(y_test, y_test_pred), 2))
print("Median absolute error =", round(sm.median_absolute_error(y_test, y_test_pred), 2))
print("Explain variance score =", round(sm.explained_variance_score(y_test, y_test_pred), 2))
print("R2 score =", round(sm.r2_score(y_test, y_test_pred), 2))
输出:
Regressor model performance:
Mean absolute error(MAE) = 1.78
Mean squared error(MSE) = 3.89
Median absolute error = 2.01
Explain variance score = -0.09
R2 score = -0.09
机器学习回归算法的类型
最有用和最流行的机器学习回归算法是线性回归算法,它进一步分为两种类型:
- 简单线性回归算法
- 多元线性回归算法
我们将在下一章中讨论并用 Python 实现它。
应用
机器学习回归算法的应用如下:
- 预测或预测分析:回归的重要用途之一是预测或预测分析。例如,我们可以预测 GDP、油价,或者简单来说是随时间变化的定量数据。
- 优化:我们可以借助回归优化业务流程。例如,商店经理可以创建统计模型来了解顾客来店的最高峰时间。
- 纠错:在商业中,做出正确决策与优化业务流程同等重要。回归可以帮助我们做出正确决策以及纠正已经实施的决策。
- 经济学:它是经济学中最常用的工具。我们可以使用回归来预测供给、需求、消费、库存投资等。
- 金融:金融公司总是对最小化风险投资组合感兴趣,并希望了解影响客户的因素。所有这些都可以借助回归模型进行预测。
15. Regression Algorithms Machine
– Overview
Learning with Python
Introduction to Regression
Regression is another important and broadly used statistical and machine learning tool.
The key objective of regression-based tasks is to predict output labels or responses which
are continues numeric values, for the given input data. The output will be based on what
the model has learned in training phase. Basically, regression models use the input data
features (independent variables) and their corresponding continuous numeric output
values (dependent or outcome variables) to learn specific association between inputs and
corresponding outputs.
Y-Output
variables,
dependent on
Input
X-Input variables,
independent in nature
96
Types of Regression Models
Machine Learning with Python
Regression Models
Simple
Multiple
(Univariate Features)
(Multiple Features)
Regression models are of following two types:
Simple regression model: This is the most basic regression model in which predictions
are formed from a single, univariate feature of the data.
Multiple regression model: As name implies, in this regression model the predictions
are formed from multiple features of the data.
Building a Regressor in Python
Regressor model in Python can be constructed just like we constructed the classifier.
Scikit-learn, a Python library for machine learning can also be used to build a regressor in
Python.
In the following example, we will be building basic regression model that will fit a line to
the data i.e. linear regressor. The necessary steps for building a regressor in Python are
as follows:
Step1: Importing necessary python package
For building a regressor using scikit-learn, we need to import it along with other necessary
packages. We can import the by using following script:
import numpy as np
from sklearn import linear_model
import sklearn.metrics as sm
import matplotlib.pyplot as plt
Step2: Importing dataset
After importing necessary package, we need a dataset to build regression prediction
model. We can import it from sklearn dataset or can use other one as per our requirement.
We are going to use our saved input data. We can import it with the help of following
script:
input = r'C:\linear.txt'
Next, we need to load this data. We are using np.loadtxt function to load it.
97
input_data = np.loadtxt(input, delimiter=',')
X, y = input_data[:, :-1], input_data[:, -1]
Machine Learning with Python
Step3: Organizing data into training & testing sets
As we need to test our model on unseen data hence, we will divide our dataset into two
parts: a training set and a test set. The following command will perform it:
training_samples = int(0.6 * len(X))
testing_samples = len(X) - num_training
X_train, y_train = X[:training_samples], y[:training_samples]
X_test, y_test = X[training_samples:], y[training_samples:]
Step4- Model evaluation & prediction
After dividing the data into training and testing we need to build the model. We will be
using LineaRegression() function of Scikit-learn for this purpose. Following command
will create a linear regressor object.
reg_linear= linear_model.LinearRegression()
Next, train this model with the training samples as follows:
reg_linear.fit(X_train, y_train)
Now, at last we need to do the prediction with the testing data.
y_test_pred = reg_linear.predict(X_test)
Step5- Plot & visualization
After prediction, we can plot and visualize it with the help of following script:
plt.scatter(X_test, y_test, color='red')
plt.plot(X_test, y_test_pred, color='black', linewidth=2)
plt.xticks(())
plt.yticks(())
plt.show()
98
Output
Machine Learning with Python
In the above output, we can see the regression line between the data points.
Step6- Performance computation: We can also compute the performance of our
regression model with the help of various performance metrics as follows:
print("Regressor model performance:")
print("Mean absolute error(MAE) =", round(sm.mean_absolute_error(y_test,
y_test_pred), 2))
print("Mean squared error(MSE) =", round(sm.mean_squared_error(y_test,
y_test_pred), 2))
print("Median absolute error =", round(sm.median_absolute_error(y_test,
y_test_pred), 2))
print("Explain variance score =", round(sm.explained_variance_score(y_test,
y_test_pred), 2))
print("R2 score =", round(sm.r2_score(y_test, y_test_pred), 2))
Output
Regressor model performance:
Mean absolute error(MAE) = 1.78
Mean squared error(MSE) = 3.89
Median absolute error = 2.01
Explain variance score = -0.09
R2 score = -0.09
99
Machine Learning with Python
Types of ML Regression Algorithms
The most useful and popular ML regression algorithm is Linear regression algorithm which
further divided into two types namely:
Simple Linear Regression algorithm
Multiple Linear Regression algorithm.
We will discuss about it and implement it in Python in the next chapter.
Applications
The applications of ML regression algorithms are as follows:
Forecasting or Predictive analysis: One of the important uses of regression is
forecasting or predictive analysis. For example, we can forecast GDP, oil prices or in simple
words the quantitative data that changes with the passage of time.
Optimization: We can optimize business processes with the help of regression. For
example, a store manager can create a statistical model to understand the peek time of
coming of customers.
Error correction: In business, taking correct decision is equally important as optimizing
the business process. Regression can help us to take correct decision as well in correcting
the already implemented decision.
Economics: It is the most used tool in economics. We can use regression to predict
supply, demand, consumption, inventory investment etc.
Finance: A financial company is always interested in minimizing the risk portfolio and
want to know the factors that affects the customers. All these can be predicted with the
help of regression model.