2.12 基本绝对值函数图表
章节大纲
-
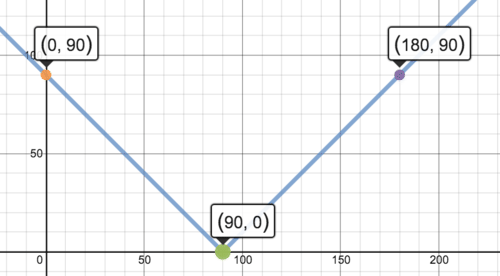
While on vacation, you go scuba diving. The surface of the water is at an unknown altitude. You descend to a depth of 90 feet below the surface of the water. What is the vertex of the absolute value function that represents your maximum possible distance from sea level?
::度假时,你去潜水。 水的表面高度未知。 你沉到水表面下方90英尺的深处。 绝对值函数的顶部是什么, 代表你与海平面的最大距离?Graphing Absolute Value Functions
::绝对值函数You have already learned how to solve and define . N ow take this idea one step further and graph absolute value equations.
::您已经学会了如何解析和定义 。 现在把这个想法再向前一步, 绘制绝对值方程式 。Graphing the Parent Graph of an Absolute Value Function
::绝对值函数的父图形图Let's follow the steps below to learn about the parent graph of absolute value functions.
::让我们遵循下面的步骤 来了解绝对值函数的母图。Step 1: G raph . Draw a table for and , with the values ranging from -3 to 3.
::第1步: 图表 yx 。 绘制 x 和 y 的表格, x - 值介于 - 3 至 3 之间 。Step 2: Recall that the absolute value of a number is always positive. P lot each of the seven coordinate pairs and graph the function.
::步骤2:回顾一个数字的绝对值总是正数。绘制七个坐标对中的每一个,并绘制函数图。Step 3: Notice that this function is very similar to the linear function , . Draw this line on the graph in a different color or with a dashed line.
::第3步:注意此函数与 y=x 线性函数非常相似。 在图形上以不同颜色或破折线绘制此线条。Step 4: Now, fold the graph on the axis. What do you notice?
::第4步:现在,折叠 X - 轴上的图表。你注意到什么了?Y ou should notice that when you fold your graph on the axis, the line becomes the absolute value equation . That is because the absolute value of a number can never be below zero; therefore the range will always be positive. is considered the parent graph because it is the most basic of all the absolute value functions. All linear absolute value functions have this “V” shape.
::您应该注意到, 当您在 x - 轴折叠您的图形时, 线 y=x 将变成绝对值方程式 y x 。 这是因为数字的绝对值永远不能低于零; 因此, 范围将永远是正的。 y x 将被视为母图, 因为它是所有绝对值函数中最基本的函数。 所有线性绝对值函数都具有此“ V” 形状 。In general, you can define the graph of as . E ach side is the mirror image of the other, over a vertical line through the vertex.
::一般而言,您可以将 yx 的图形定义为 yx;x0-x;x<0。 每一面都是另一面的镜像, 穿过顶端的垂直线。Now, let's use a table to graph the following functions.
::现在,让我们用一个表格来绘制以下函数的图形。-
Graph
. Determine the
domain
and range.
::图形 yx-3. 确定域和范围。
In general, when you use a table to graph a function, pick some positive and negative numbers, as well as zero. Use the equation to help you determine which values to pick. Setting what is inside the absolute value equal to zero yields . Pick three values on either side of and then graph.
::一般而言,当您使用表格来绘制函数时,请选择一些正数和负数,以及零。使用方程式来帮助您确定要选择的 x- 值。设置绝对值内值等于零收益x=3。在 x=3 的两侧选择三个值,然后绘制图形。0 3 1 2 2 1 3 0 4 1 5 2 6 3 Notice that this graph shifts to the right 3 when compared to the parent graph. The domain will be all real numbers, , and the range will be all positive real numbers, including zero,
::请注意, 此图表与父图形比较时向右移到右 3 。 域名将全部为真实数字 xR, 范围将全部为正数, 包括零, y_ {0} 。-
G
raph
. Determine the domain and range.
::5. 确定域域和范围。
Be careful! Here, the minus 5 is not inside the absolute value. So, first take the absolute value of the value and then subtract 5. In cases like these, where a value is subtracted after taking the absolute value, the range may include negative numbers.
::注意! 在这里, 负 5 不在绝对值之内。 所以, 首先取 x- value 的绝对值, 然后减去 5 。 在这样的情况下, 如果在计算绝对值后减去一个数值, 则范围可能包括负数 。Here, the graph shifts down 5 when compared to the parent graph. The domain will be all real numbers, , and the range will be all real numbers greater than or equal to -5,
::这里, 图形与父图形相比向下移动 5 。 域将全部为真实数字 xR, 区域将全部为实际数字大于或等于 5 y y y {-5} 。In these t wo absolute value graphs, you may have noticed that there is a minimum point. This point is called the vertex. For instance , in the previous problem, the vertex is (0, -5). The vertex can also be a maximum. See the next problem.
::在这两个绝对值图形中,您可能注意到有一个最小点。这个点被称为顶点。例如,在上一个问题中,顶点为 0, - 5。顶点也可以是一个最大值。请看下一个问题。-
Use a table to graph
Determine the vertex, domain, and range.
::使用表格绘制 yx- 12. 确定顶点、 域和范围 。
Determine the -value that makes the inside of the absolute value equation zero . Then make a table of values, including a couple values on either side of that -value.
::确定使绝对值方程式零(x=1)内部成为绝对值方程式零(x=1)的 x 值,然后绘制一个数值表,包括该X 值两侧的一对数值。-2 -1 -1 0 0 1 1 2 2 1 3 0 4 -1 The vertex is (1, 2) and in this case, it is the maximum value. The domain is , and the range is
::顶点是(1, 2) , 在此情况下, 是最大值 。 域是 xR, 范围是 y( , 2) 。Examples
::实例Example 1
::例1Earlier, you were asked to identify the vertex of an absolute value function that represents your possible distance from sea level after diving.
::早些时候,有人要求你确定 绝对值函数的顶点 代表你潜入后 可能距离海平面的距离The absolute value function that represents this situation is where is your altitude above or below sea level before diving. By graphing this function, you can see that the vertex occurs at the point (90, 0).
::表示此状态的绝对值函数是 yx- 90 , x 是潜水前海平面以上或以下的高度。 通过图形化此函数, 您可以看到顶点( 90, 0) 发生于点( 90, 0) 。Example 2
::例2Graph using a table. Determine the vertex, domain, and range.
::使用表格确定顶点、域和范围。Determine what makes the inside of the absolute value equation zero, . Then, to make a table of values, pick a couple values on either side of .
::确定绝对值零的内值, x=5 。 然后,要绘制一个数值表,请在 x=5 的两侧选择一对数值。2 -3 3 -2 -4 -1 5 0 6 -1 7 -2 8 -3 The vertex is (5, 0) and in this case, it is the maximum value. The domain is , and the range is
::顶点是 (5, 0) , 在此情况下, 是最大值 。 域是 xR, 范围是 y( , 0) 。Example 3
::例3Use a table to graph Determine the vertex, domain, and range.
::使用表格绘制 yx+42. 确定顶点、 域和范围 。Determine what makes the inside of the absolute value equation zero, . Then make a table of values, including a couple values on either side of .
::确定绝对值零的内值, x4。 然后绘制一个数值表, 包括 x4 的两面的数值 。1 -2 0 -3 -1 -4 -2 -5 -1 -6 0 -7 1 The vertex is (-4, -2) and in this case, it is the minimum value. The domain is , and the range is
::顶点是 (4, 4, 2) , 在此情况下, 这是最小值 。 域是 x R, 范围是 y [ - 2, ] 。Review
::回顾Graph the following functions using a table. Determine the vertex, domain, and range of each function.
::用表格绘制以下函数的图。确定每个函数的顶点、域和范围。-
::yx+6________________________________________________________________________________________________________________________________________________________________________________________________________________________________________________________________ -
::~ ~~~~~~~~~~~~~~~~~~~~~~~~~~~~~~~~~~~~~~~~~~~~~~~~~~~~~~~~~~~~~~~~~~~~~~~~~~~~~~~~~~~~~~~~~~~~~~~~~~~~~~~~~~~~~~~~~~~~~~~~~~~~~~~~~~~~~~~~~~~~~~~~~~~~~~~~~~~~~~~ -
::yx3 -
::y'x%2 -
::yx+3+7 -
::yx - 16 -
::y=2x -
::~ ~ ~ ~ ~ ~ ~ ~ ~ ~ ~ ~ ~ ~ ~ ~ ~ ~ ~ ~ ~ ~ ~ ~ ~ ~ ~ ~ ~ ~ ~ ~ ~ ~ ~ -
::y=13=x*}Y=13=x*}Y=13=x*}Y=13=x*}Y=13=x*}Y=13=x*
Reference problems 1-9 as needed to fill in the blanks in problems 10-15.
::需要参考问题1-9,以填补问题10-15中的空白。-
If there is a negative sign in front of the absolute value, the graph is ________________ (when compared to the parent graph).
::如果绝对值前面有一个负符号,则图表为 _______(与母图比较时)。 -
If the equation is
, the vertex will be ___________________.
::如果等式是yx-hk,顶点将是。 -
The domain of an absolute value function is always ____________________________.
::绝对值函数的域始终是 {} {} 。 -
For
, if
, then the graph will be ___________________ than the parent graph.
::对于 y=ax, 如果 a>1, 则图形将比 父图形为 \\\ 。 -
For
, if
, then the graph will be ___________________ than the parent graph.
::y=ax,如果 0<a<1, 则图形将比父图形为 \\\\ 。 -
Without making a table, what is the vertex of
::不做桌子,你-9-7的顶点是什么?
Review (Answers)
::回顾(答复)Click to see the answer key or go to the Table of Contents and click on the Answer Key under the 'Other Versions' option.
::单击可查看答题键, 或转到目录中, 单击“ 其他版本” 选项下的答题键 。 -
Graph
. Determine the
domain
and range.