机器学习
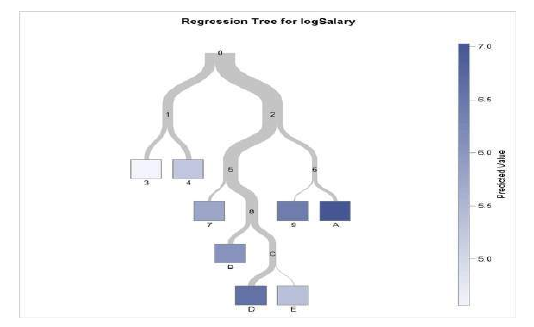
回归树是指目标变量是连续的算法,该算法用于预测其值。例如,您可能希望预测住宅的销售价格,这是一个连续的因变量。
这将取决于连续因素,如平方英尺,以及类别因素,如房屋风格、房产所在区域等。
何时使用分类树和回归树
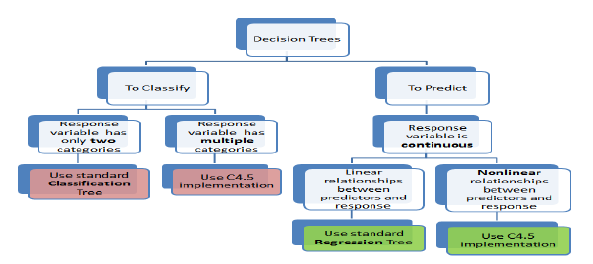
分类树用于需要将数据集分割成属于响应变量的类别的情况。在许多情况下,类别是“是”或“否”。
换句话说,它们只有两个且互斥。在某些情况下,可能有两个以上的类别,此时会使用分类树算法的变体。
另一方面,回归树用于响应变量是连续的情况。例如,如果响应变量是属性的价格或当天的温度,则使用回归树。
换句话说,回归树用于预测型问题,而分类树用于分类型问题。
分类树和回归树的工作原理
分类树根据数据的同质性来分割数据集。例如,假设有两个变量:收入和年龄;它们决定消费者是否会购买某种手机。
如果训练数据表明 95% 超过 30 岁的人购买了手机,数据就会在那里分割,年龄成为树的顶层节点。这种分割使数据“95% 纯净”。熵或基尼指数等不纯度度量用于量化分类树中数据的同质性。
在回归树中,回归模型将拟合目标变量,使用每个自变量。之后,数据在每个自变量的几个点处进行分割。
在每个这样的点上,预测值和实际值之间的误差被平方,得到“平方误差和”(SSE)。SSE 在变量之间进行比较,选择SSE 最低的变量或点作为分割点。这个过程递归地继续。
分类树和回归树的优点
任何分类或回归树分析的目的都是创建一组 if-else 条件,以实现对案例的准确预测或分类。
(i) 结果简单
分类或回归树中总结的结果解释通常相当简单。结果的简单性有以下几个好处。
- 它允许快速分类新的观测值。这是因为评估一两个逻辑条件比使用每个组的复杂非线性方程计算分数要简单得多。
- 它通常可以得到一个更简单的模型,解释了为什么观测值以某种方式被分类或预测。例如,商业问题用 if-then 语句解释比用复杂的非线性方程更容易。
(ii) 分类树和回归树是非参数和非线性的
分类和回归树的结果可以用简单的 if-then 条件来总结。这消除了以下隐含假设的需要。
- 预测变量和因变量是线性的。
- 预测变量和因变量遵循某种特定的非线性链接函数。
- 预测变量和因变量是单调的。
由于不需要这些隐含假设,分类和回归树方法非常适合数据挖掘。这是因为在不同变量如何关联方面,事先可以做的知识或假设非常少。
因此,分类和回归树实际上可以揭示这些变量之间的关系,而这是其他技术无法实现的。
(iii) 分类树和回归树隐含地执行特征选择
特征选择或变量筛选是分析的重要组成部分。当我们使用决策树时,树分裂的顶部几个节点是集合中最重要的变量。因此,特征选择会自动执行,我们无需再次进行。
分类树和回归树的局限性
分类和回归树的教程以及相关的PPT非常丰富。这证明了这些决策树的受欢迎程度以及它们被频繁使用的程度。然而,这些决策树并非没有缺点。
有许多分类和回归树的例子表明,决策树的使用并未导致最佳结果。以下是分类和回归树的一些局限性。
(i) 过拟合
过拟合发生在树考虑了数据中存在的大量噪声并得出不准确结果时。
(ii) 高方差
在这种情况下,数据中的微小方差可能导致预测中的非常高方差,从而影响结果的稳定性。
(iii) 低偏差
非常复杂的决策树通常具有低偏差。这使得模型很难整合任何新数据。
机器学习中的 CART 是什么?
**分类和回归树(CART)**是机器学习中使用的一种预测算法。它解释了如何根据其他值预测目标变量的值。
它是一种决策树,其中每个分叉是预测变量中的一个分裂,每个末端节点都包含目标变量的预测。
CART 算法是重要的决策树算法,是机器学习的基础。此外,它也是其他强大机器学习算法(如袋装决策树、随机森林和梯度提升决策树)的基础。
总结
分类和回归树(CART)方法是最古老和最基础的算法之一。它用于根据某些预测变量预测结果。
它们非常适合数据挖掘任务,因为它们需要很少的数据预处理。决策树模型易于理解和实现,这使得它们与其他分析模型相比具有强大的优势。
A regression tree refers to an algorithm where the target variable is and the algorithm is used to
predict it’s value. As an example of a regression type problem, you may want to predict the selling
prices of a residential house, which is a continuous dependent variable.
This will depend on both continuous factors like square footage as well as categorical factors like the
style of home, area in which the property is located and so on.
When to use Classification and Regression Trees
Classification trees are used when the dataset needs to be split into classes which belong to the
response variable. In many cases, the classes Yes or No.
In other words, they are just two and mutually exclusive. In some cases, there may be more than two
classes in which case a variant of the classification tree algorithm is used.
Regression trees, on the other hand, are used when the response variable is continuous. For instance, if
the response variable is something like the price of a property or the temperature of the day, a
regression tree is used.
In other words, regression trees are used for prediction-type problems while classification trees are
used for classification-type problems.
How Classification and Regression Trees Work
A classification tree splits the dataset based on the homogeneity of data. Say, for instance,
there are two variables; income and age; which determine whether or not a consumer will buy a
particular kind of phone.
If the training data shows that 95% of people who are older than 30 bought the phone, the data gets
split there and age becomes a top node in the tree. This split makes the data “95% pure”. Measures of
impurity like entropy or Gini index are used to quantify the homogeneity of the data when it comes to
classification trees.
In a regression tree, a regression model is fit to the target variable using each of the independent
variables. After this, the data is split at several points for each independent variable.
At each such point, the error between the predicted values and actual values is squared to get “A Sum
of Squared Errors” (SSE). The SSE is compared across the variables and the variable or point which has
the lowest SSE is chosen as the split point. This process is continued recursively.
Advantages of Classification and Regression Trees
The purpose of the analysis conducted by any classification or regression tree is to create a set of if-else
conditions that allow for the accurate prediction or classification of a case.
(i) The Results are Simplistic
The interpretation of results summarized in classification or regression trees is usually fairly simple. The
simplicity of results helps in the following ways.
It allows for the rapid classification of new observations. That’s because it is much simpler to
evaluate just one or two logical conditions than to compute scores using complex nonlinear
equations for each group.
It can often result in a simpler model which explains why the observations are either classified
or predicted in a certain way. For instance, business problems are much easier to explain with
if-then statements than with complex nonlinear equations.
(ii) Classification and Regression Trees are Nonparametric & Nonlinear
The results from classification and regression trees can be summarized in simplistic if-then conditions.
This negates the need for the following implicit assumptions.
The predictor variables and the dependent variable are linear.
The predictor variables and the dependent variable follow some specific nonlinear link function.
The predictor variables and the dependent variable are monotonic.
Since there is no need for such implicit assumptions, classification and regression tree methods are well
suited to data mining. This is because there is very little knowledge or assumptions that can be made
beforehand about how the different variables are related.
As a result, classification and regression trees can actually reveal relationships between these variables
that would not have been possible using other techniques.
(iii) Classification and Regression Trees Implicitly Perform Feature Selection
Feature selection or variable screening is an important part of analytics. When we use decision trees,
the top few nodes on which the tree is split are the most important variables within the set. As a result,
feature selection gets performed automatically and we don’t need to do it again.
Limitations of Classification and Regression Trees
Classification and regression tree tutorials, as well as classification and regression tree ppts, exist in
abundance. This is a testament to the popularity of these decision trees and how frequently they are
used. However, these decision trees are not without their disadvantages.
There are many classification and regression trees examples where the use of a decision tree has not
led to the optimal result. Here are some of the limitations of classification and regression trees.
(i) Overfitting
Overfitting occurs when the tree takes into account a lot of noise that exists in the data and
comes up with an inaccurate result.
(ii) High variance
In this case, a small variance in the data can lead to a very high variance in the prediction,
thereby affecting the stability of the outcome.
(iii) Low bias
A decision tree that is very complex usually has a low bias. This makes it very difficult for the
model to incorporate any new data.
What is a CART in Machine Learning?
A Classification and Regression Tree (CART) is a predictive algorithm used in machine learning. It
explains how a target variable’s values can be predicted based on other values.
It is a decision tree where each fork is a split in a predictor variable and each node at the end has a
prediction for the target variable.
The CART algorithm is an important decision tree algorithm that lies at the foundation of machine
learning. Moreover, it is also the basis for other powerful machine learning algorithms like bagged
decision trees, random forest and boosted decision trees.
Summing up
The Classification and regression tree (CART) methodology is one of the oldest and most fundamental
algorithms. It is used to predict outcomes based on certain predictor variables.
They are excellent for data mining tasks because they require very little data pre-processing. Decision
tree models are easy to understand and implement which gives them a strong advantage when
compared to other analytical models.