机器学习
机器学习中的回归分析
回归分析是一种统计方法,用于建立因变量(目标变量)与一个或多个自变量(预测变量)之间的关系模型。更具体地说,回归分析帮助我们理解在其他自变量保持不变的情况下,因变量的值如何随着自变量的变化而变化。它预测连续/实数值,如温度、年龄、薪水、价格等。
我们可以通过以下示例来理解回归分析的概念:
示例:假设有一家营销公司 A,每年都会进行各种广告宣传并获得相应的销售额。以下列表显示了该公司过去 5 年的广告投入和相应的销售额:
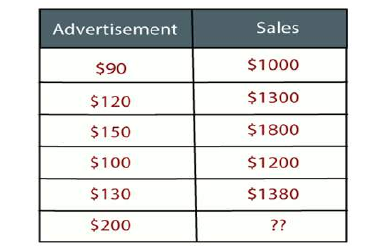
现在,该公司希望在 2019 年投入 200 美元的广告,并希望了解今年的销售预测。为了解决机器学习中这类预测问题,我们需要回归分析。
回归是一种监督学习技术,它有助于找到变量之间的相关性,并使我们能够基于一个或多个预测变量来预测连续的输出变量。它主要用于预测、预报、时间序列建模以及确定变量之间的因果关系。
在回归中,我们绘制一个最能拟合给定数据点的变量图,利用这个图,机器学习模型可以对数据进行预测。简而言之,“回归表示一条穿过目标-预测变量图上所有数据点的直线或曲线,使得数据点与回归线之间的垂直距离最小。”数据点与线之间的距离表明模型是否捕获了强烈的关系。
回归的一些示例可以是:
- 利用温度和其他因素预测降雨量。
- 确定市场趋势。
- 预测由于鲁莽驾驶造成的道路交通事故。
与回归分析相关的术语
- 因变量(Dependent Variable):回归分析中我们想要预测或理解的主要因素被称为因变量。它也称为目标变量。
- 自变量(Independent Variable):影响因变量或用于预测因变量值的因素被称为自变量,也称为预测变量。
- 异常值(Outliers):异常值是与其他观测值相比包含非常低值或非常高值的观测值。异常值可能会影响结果,因此应避免。
- 多重共线性(Multicollinearity):如果自变量之间彼此高度相关,则这种条件称为多重共线性。它不应该存在于数据集中,因为它在对最具影响力的变量进行排序时会产生问题。
- 欠拟合和过拟合(Underfitting and Overfitting):如果我们的算法在训练数据集上表现良好,但在测试数据集上表现不佳,则这种问题称为过拟合。如果我们的算法甚至在训练数据集上都表现不佳,则这种问题称为欠拟合。
为什么我们使用回归分析?
如上所述,回归分析有助于预测连续变量。在现实世界中,有各种场景我们需要进行未来预测,例如天气状况、销售预测、市场趋势等,对于这种情况,我们需要一些能够更准确进行预测的技术。因此,在这种情况下,我们需要回归分析,它是一种统计方法,用于机器学习和数据科学。以下是使用回归分析的一些其他原因:
- 回归估计目标变量与自变量之间的关系。
- 它用于查找数据中的趋势。
- 它有助于预测实数/连续值。
- 通过执行回归,我们可以自信地确定最重要的因素、最不重要的因素,以及每个因素如何影响其他因素。
回归的类型
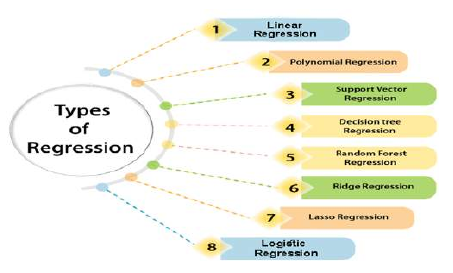
数据科学和机器学习中使用了各种类型的回归。每种类型在不同的场景中都有其重要性,但其核心是,所有回归方法都分析了自变量对因变量的影响。下面我们讨论一些重要的回归类型:
- 线性回归
- 逻辑回归
- 多项式回归
- 支持向量回归
- 决策树回归
- 随机森林回归
- 岭回归
- Lasso 回归
2.2. Regression
Regression Analysis in Machine learning
Regression analysis is a statistical method to model the relationship between a dependent
(target) and independent (predictor) variables with one or more independent variables. More
specifically, Regression analysis helps us to understand how the value of the dependent variable is
changing corresponding to an independent variable when other independent variables are held fixed. It
predicts continuous/real values such as temperature, age, salary, price, etc.
We can understand the concept of regression analysis using the below example:
Example: Suppose there is a marketing company A, who does various advertisement every year and get
sales on that. The below list shows the advertisement made by the company in the last 5 years and the
corresponding sales:
Now, the company wants to do the advertisement of $200 in the year 2019 and wants to know the
prediction about the sales for this year. So to solve such type of prediction problems in machine
learning, we need regression analysis.
Regression is a supervised learning technique which helps in finding the correlation between variables
and enables us to predict the continuous output variable based on the one or more predictor variables.
It is mainly used for prediction, forecasting, time series modeling, and determining the causal-effect
relationship between variables.
In Regression, we plot a graph between the variables which best fits the given datapoints, using this
plot, the machine learning model can make predictions about the data. In simple words, "Regression
shows a line or curve that passes through all the datapoints on target-predictor graph in such a way
that the vertical distance between the datapoints and the regression line is minimum." The distance
between datapoints and line tells whether a model has captured a strong relationship or not.
Some examples of regression can be as:
o Prediction of rain using temperature and other factors
o Determining Market trends
o Prediction of road accidents due to rash driving.
TerminologiesoooooRelated to the Regression Analysis:
Dependent Variable: The main factor in Regression analysis which we want to predict or
understand is called the dependent variable. It is also called target variable.
Independent Variable: The factors which affect the dependent variables or which are used to
predict the values of the dependent variables are called independent variable, also called as
a predictor.
Outliers: Outlier is an observation which contains either very low value or very high value in
comparison to other observed values. An outlier may hamper the result, so it should be
avoided.
Multicollinearity: If the independent variables are highly correlated with each other than other
variables, then such condition is called Multicollinearity. It should not be present in the dataset,
because it creates problem while ranking the most affecting variable.
Underfitting and Overfitting: If our algorithm works well with the training dataset but not well
with test dataset, then such problem is called Overfitting. And if our algorithm does not
perform well even with training dataset, then such problem is called underfitting.
32
Why do we use Regression Analysis?
As mentioned above, Regression analysis helps in the prediction of a continuous variable. There are
various scenarios in the real world where we need some future predictions such as weather condition,
sales prediction, marketing trends, etc., for such case we need some technology which can make
predictions more accurately. So for such case we need Regression analysis which is a statistical method
and used in machine learning and data science. Below are some other reasons for using Regression
analysis:
o Regression estimates the relationship between the target and the independent variable.
o It is used to find the trends in data.
o It helps to predict real/continuous values.
o By performing the regression, we can confidently determine the most important factor, the
least important factor, and how each factor is affecting the other factors.
Types of Regression
There are various types of regressions which are used in data science and machine learning. Each type
has its own importance on different scenarios, but at the core, all the regression methods analyze the
effect of the independent variable on dependent variables. Here we are discussing some important
types of regression which are given below:
o Linear Regression
o Logistic Regression
o Polynomial Regression
o Support Vector Regression
o Decision Tree Regression
o Random Forest Regression
o Ridge Regression
o Lasso Regression