机器学习
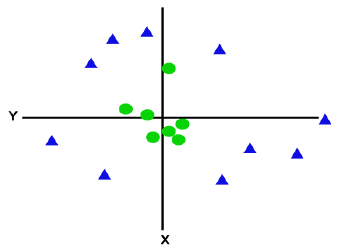
如果数据是线性排列的,我们可以用一条直线将其分开;但对于非线性数据,我们无法画出一条单一的直线。请看下图:
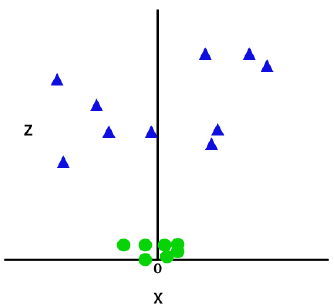
为了分离这些数据点,我们需要增加一个维度。对于线性数据,我们使用了二维 x 和 y,所以对于非线性数据,我们将增加第三个维度 z。它可以计算为:
增加第三个维度后,样本空间将如下图所示:
现在,SVM 将以下面的方式将数据集分成不同的类别。请看下图:
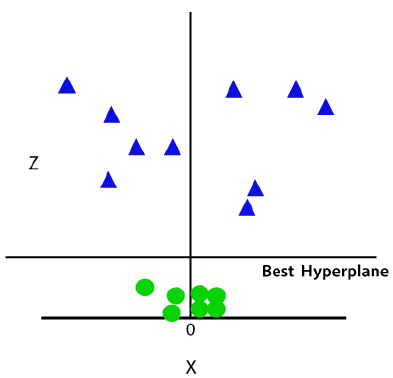
由于我们现在处于三维空间中,因此它看起来像一个平行于 x 轴的平面。如果我们将它转换回二维空间,并设 ,那么它将变成:
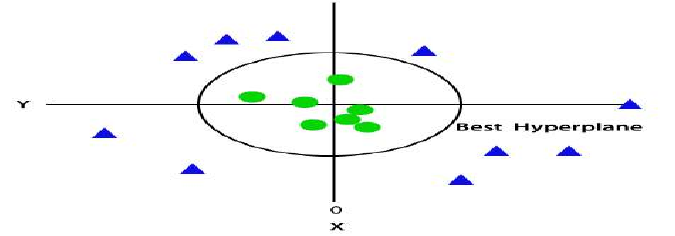
因此,在非线性数据的情况下,我们得到了一个半径为 1 的圆周。
If data is linearly arranged, then we can separate it by using a straight line, but for non-linear
data, we cannot draw a single straight line. Consider the below image:
So to separate these data points, we need to add one more dimension. For linear data, we have used two dimensions
x and y, so for non-linear data, we will add a third dimension z. It can be calculated as:
z=x2 +y 2
By adding the third dimension, the sample space will become as below image:
So now, SVM will divide the datasets into classes in the following way. Consider the below image:
Since we are in 3-d Space, hence it is looking like a plane parallel to the x-axis. If we convert it in 2d
space with z=1, then it will become as:
Hence we get a circumference of radius 1 in case of non-linear data.