机器学习Python教程
用 Python 生成合成数据
 机器学习中,尤其是在初学者想要了解算法时,一个常见的问题是很难获得合适的数据集。有些数据集价格昂贵,有些则因受版权保护而无法免费获取。因此,在某些情况下,人工生成测试数据可能是一个解决方案。
出于这个原因,本教程的这一章将重点介绍数据的人工生成。
本章的目的是创建人工数据。在本教程前面的章节中,我们了解到 Scikit-Learn (sklearn) 包含了不同的数据集。一方面,它有小型的玩具数据集,但它也提供了更大的数据集,这些数据集在机器学习社区中经常用于测试算法或作为基准。这些数据集为我们提供了来自“真实世界”的数据。
所有这些都很棒,但在许多情况下这仍然不够。也许您找到了正确类型的数据,但您需要更多此类数据,或者数据并不完全是您正在寻找的那种数据,例如,您可能需要更复杂或更不复杂的数据。这时您就应该考虑自己创建数据。在这方面,sklearn 提供了帮助。它包含了各种随机样本生成器,可用于创建定制的人工数据集。这些数据集能够满足您对大小和复杂度的要求。
以下 Python 代码是一个简单的例子,我们用它为一些德国城市创建人工天气数据。我们使用 Pandas 和 Numpy 来创建数据:
import numpy as np
import pandas as pd

cities = ['Berlin', 'Frankfurt', 'Hamburg',
          'Nuremberg', 'Munich', 'Stuttgart',
          'Hanover', 'Saarbruecken', 'Cologne',
          'Constance', 'Freiburg', 'Karlsruhe'
         ]
n = len(cities)

data = {'Temperature': np.random.normal(24, 3, n),  # 平均温度24度,标准差3度
        'Humidity': np.random.normal(78, 2.5, n),    # 平均湿度78%,标准差2.5%
        'Wind': np.random.normal(15, 4, n)           # 平均风速15,标准差4
       }

df = pd.DataFrame(data=data, index=cities)
print(df)
输出:
|
Temperature |
Humidity |
Wind |
|
|
Berlin |
20.447301 |
75.516079 |
12.566956 |
|
Frankfurt |
27.319526 |
77.010523 |
11.800371 |
|
Hamburg |
24.783113 |
80.200985 |
14.489432 |
|
Nuremberg |
25.823295 |
76.430166 |
19.903070 |
|
Munich |
21.037610 |
81.589453 |
17.677132 |
|
Stuttgart |
25.560423 |
75.384543 |
20.832011 |
|
Hanover |
22.073368 |
81.704236 |
12.421998 |
|
Saarbruecken |
25.722280 |
80.131432 |
10.694502 |
|
Cologne |
25.658240 |
79.430957 |
16.360829 |
|
Constance |
29.221204 |
75.626223 |
17.281035 |
|
Freiburg |
25.625042 |
81.227281 |
6.850105 |
|
Karlsruhe |
26.245587 |
81.546979 |
11.787846 |
另一个例子
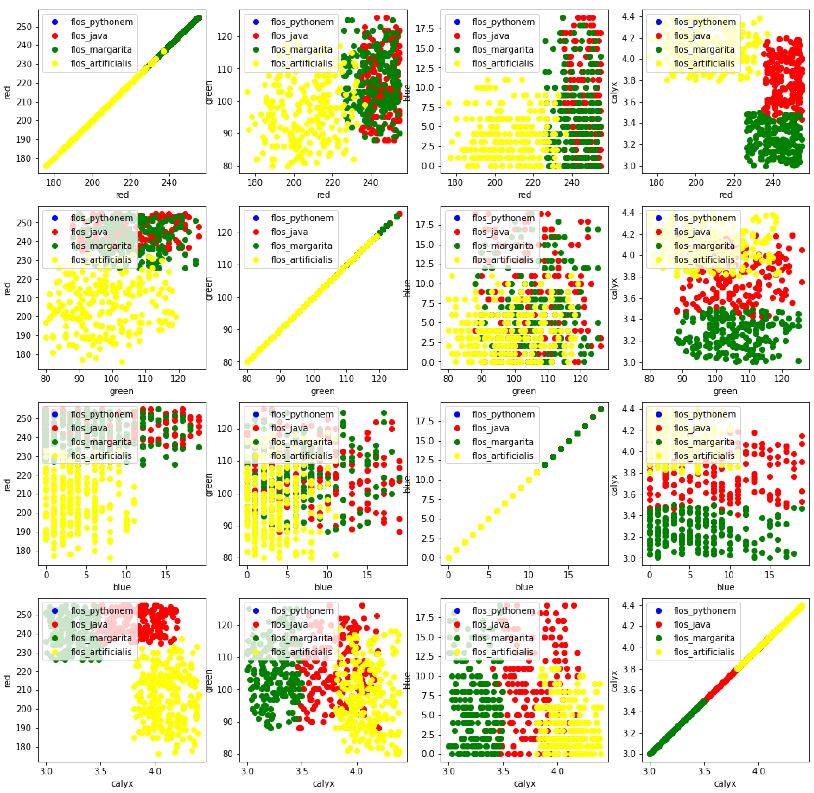
我们将为四种不存在的花创建人工数据。如果这些名字让您想起编程语言和披萨,那绝非巧合:
-
Flos Pythonem
-
Flos Java
-
Flos Margarita
-
Flos artificialis
相应的 RGB 平均颜色值是:
-
(255, 0, 0)
-
(245, 107, 0)
-
(206, 99, 1)
-
(255, 254, 101)
花萼的平均直径是:
-
3.8
-
3.3
-
4.1
-
2.9
|
花名 |
RGB 平均颜色值 |
花萼平均直径 |
|
Flos Pythonem |
(254, 0, 0) |
3.8 |
|
Flos Java |
(245, 107, 0) |
3.3 |
|
Flos margarita |
(206, 99, 1) |
4.1 |
|
Flos artificialis |
(255, 254, 101) |
2.9 |
import matplotlib.pyplot as plt
import numpy as np
import pandas as pd
from scipy.stats import truncnorm

# 定义一个函数,生成截断正态分布
def truncated_normal(mean=0, sd=1, low=0, upp=10):
    return truncnorm(
        (low - mean) / sd, (upp - mean) / sd, loc=mean, scale=sd)

# 定义一个函数,生成截断正态分布的浮点数
def truncated_normal_floats(mean=0, sd=1, low=0, upp=10, num=100):
    res = truncated_normal(mean=mean, sd=sd, low=low, upp=upp)
    return res.rvs(num)

# 定义一个函数,生成截断正态分布的整数
def truncated_normal_ints(mean=0, sd=1, low=0, upp=10, num=100):
    res = truncated_normal(mean=mean, sd=sd, low=low, upp=upp)
    return res.rvs(num).astype(np.uint8)

# 每种花类的项目数量:
number_of_items_per_class = [190, 205, 230, 170]
flowers = {}

# flos Pythonem:
number_of_items = number_of_items_per_class[0]
reds = truncated_normal_ints(mean=254, sd=18, low=235, upp=256,
num=number_of_items)
greens = truncated_normal_ints(mean=107, sd=11, low=88, upp=127,
num=number_of_items)
blues = truncated_normal_ints(mean=0, sd=15, low=0, upp=20,
num=number_of_items)
calyx_dia = truncated_normal_floats(3.8, 0.3, 3.4, 4.2,
num=number_of_items)
data = np.column_stack((reds, greens, blues, calyx_dia))
flowers["flos_pythonem"] = data

# flos Java:
number_of_items = number_of_items_per_class[1]
reds = truncated_normal_ints(mean=245, sd=17, low=226, upp=256,
num=number_of_items)
greens = truncated_normal_ints(mean=107, sd=11, low=88, upp=127,
num=number_of_items)
blues = truncated_normal_ints(mean=0, sd=10, low=0, upp=20,
num=number_of_items)
calyx_dia = truncated_normal_floats(3.3, 0.3, 3.0, 3.5,
num=number_of_items)
data = np.column_stack((reds, greens, blues, calyx_dia))
flowers["flos_java"] = data

# flos Margarita:
number_of_items = number_of_items_per_class[2]
reds = truncated_normal_ints(mean=206, sd=17, low=175, upp=238,
num=number_of_items)
greens = truncated_normal_ints(mean=99, sd=14, low=80, upp=120,
num=number_of_items)
blues = truncated_normal_ints(mean=1, sd=5, low=0, upp=12,
num=number_of_items)
calyx_dia = truncated_normal_floats(4.1, 0.3, 3.8, 4.4,
num=number_of_items)
data = np.column_stack((reds, greens, blues, calyx_dia))
flowers["flos_margarita"] = data

# flos artificialis:
number_of_items = number_of_items_per_class[3]
reds = truncated_normal_ints(mean=255, sd=8, low=245, upp=255, # 注意:原文中的 low=2245 是一个笔误,应为 245
num=number_of_items)
greens = truncated_normal_ints(mean=254, sd=10, low=240, upp=255,
num=number_of_items)
blues = truncated_normal_ints(mean=101, sd=5, low=90, upp=112,
num=number_of_items)
calyx_dia = truncated_normal_floats(2.9, 0.4, 2.4, 3.5,
num=number_of_items)
data = np.column_stack((reds, greens, blues, calyx_dia))
flowers["flos_artificialis"] = data

# 将所有花的数据连接起来
data = np.concatenate((flowers["flos_pythonem"],
                       flowers["flos_java"],
                       flowers["flos_margarita"],
                       flowers["flos_artificialis"]
                      ), axis=0)

# 分配标签
target = np.zeros(sum(number_of_items_per_class)) # 4 种花
previous_end = 0
for i in range(1, 5):
    num = number_of_items_per_class[i-1]
    beg = previous_end
    target[beg: beg + num] += i - 1 # 标签从 0 开始
    previous_end = beg + num

# 将数据和标签连接起来
conc_data = np.concatenate((data, target.reshape(target.shape[0], 1)), axis=1)

# 保存到文件 (假设存在 'data' 文件夹)
# np.savetxt("data/strange_flowers.txt", conc_data, fmt="%2.2f") # 如果没有data文件夹会报错

# 可视化生成的花数据
target_names = list(flowers.keys())
feature_names = ['red', 'green', 'blue', 'calyx']
n = 4 # 特征数量

fig, ax = plt.subplots(n, n, figsize=(16, 16))
colors = ['blue', 'red', 'green', 'yellow'] # 对应四种花的颜色

for x in range(n):
    for y in range(n):
        xname = feature_names[x]
        yname = feature_names[y]

        for color_ind in range(len(target_names)):
            # 绘制散点图,data[:, x] 表示所有样本的第 x 个特征
            ax[x, y].scatter(data[target==color_ind, x], # x轴数据
                             data[target==color_ind, y], # y轴数据
                             label=target_names[color_ind], # 图例标签
                             c=colors[color_ind]) # 散点颜色

        ax[x, y].set_xlabel(xname) # 设置x轴标签
        ax[x, y].set_ylabel(yname) # 设置y轴标签
        ax[x, y].legend(loc='upper left') # 显示图例

plt.show()
使用 Scikit-Learn 生成合成数据
使用 Scikit-Learn 的功能来创建合成数据会容易得多。
sklearn 中可用的功能大致可以分为:
-
分类和聚类的生成器
-
回归数据生成器
-
流形学习生成器
-
分解生成器
分类和聚类的生成器
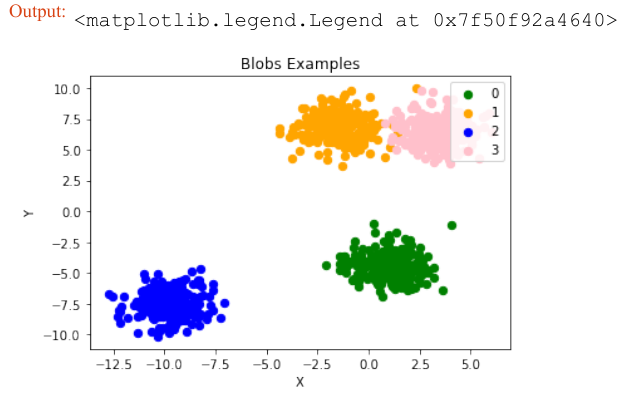
我们从 sklearn.datasets 中的 make_blobs 函数开始,它用于创建“斑点状”数据分布。通过将 centers 的值设置为 n_classes,我们确定斑点(即簇)的数量。n_samples 对应于在簇之间平均分配的总点数。如果未设置 random_state,那么每次调用函数时都会得到随机结果。我们将一个整数传递给这个参数,以确保在多次函数调用中输出可重现。
import numpy as np
import matplotlib.pyplot as plt
from sklearn.datasets import make_blobs

n_classes = 4 # 类别数量
data, labels = make_blobs(n_samples=1000, # 样本总数
                          centers=n_classes, # 簇的数量
                          random_state=100) # 随机种子,用于结果可重现

print(labels[:7])
输出:array([1, 3, 1, 3, 1, 3, 2])
我们将使用 matplotlib 可视化之前创建的斑点簇:
fig, ax = plt.subplots()
colours = ('green', 'orange', 'blue', "pink") # 定义颜色

for label in range(n_classes):
    ax.scatter(x=data[labels==label, 0], # x轴数据
               y=data[labels==label, 1], # y轴数据
               c=colours[label], # 颜色
               s=40, # 标记大小
               label=label) # 图例标签

ax.set(xlabel='X',
       ylabel='Y',
       title='BlobsExamples')
ax.legend(loc='upper right')
plt.show() # 显示图表
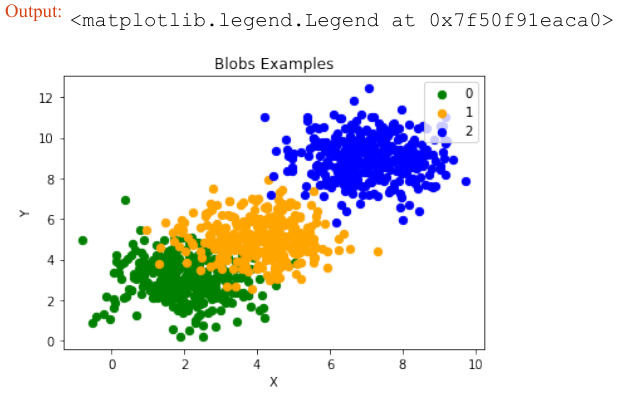
在上面的例子中,斑点的中心是随机选择的。在下面的例子中,我们明确地设置斑点的中心。我们创建一个包含中心点的列表,并将其传递给 centers 参数:
import numpy as np
import matplotlib.pyplot as plt
from sklearn.datasets import make_blobs

centers = [[2, 3], [4, 5], [7, 9]] # 明确定义的中心点
data, labels = make_blobs(n_samples=1000,
                          centers=np.array(centers),
                          random_state=1)

print(labels[:7])
输出:array([0, 1, 1, 0, 2, 2, 2])
让我们来看看之前创建的斑点簇:
fig, ax = plt.subplots()
colours = ('green', 'orange', 'blue') # 定义颜色

for label in range(len(centers)):
    ax.scatter(x=data[labels==label, 0],
               y=data[labels==label, 1],
               c=colours[label],
               s=40,
               label=label)

ax.set(xlabel='X',
       ylabel='Y',
       title='BlobsExamples')
ax.legend(loc='upper right')
plt.show() # 显示图表
通常,您希望将人工创建的数据集保存到文件中。为此,我们可以使用 numpy 中的 savetxt 函数。在此之前,我们必须重新排列数据。每行应同时包含数据和标签:
import numpy as np

# 将标签从一维数组转换为二维列向量
labels = labels.reshape((labels.shape[0], 1))
# 将数据和标签水平拼接
all_data = np.concatenate((data, labels), axis=1)

print(all_data[:7])
输出:
[[ 1.72415394,  4.22895559,  0.        ],
 [ 4.16466507,  5.77817418,  1.        ],
 [ 4.51441156,  4.98274913,  1.        ],
 [ 1.49102772,  2.83351405,  0.        ],
 [ 6.0386362 ,  7.57298437,  2.        ],
 [ 5.61044976,  9.83428321,  2.        ],
 [ 5.69202866, 10.47239631,  2.        ]]
对于某些人来说,理解 reshape 和 concatenate 的组合可能比较复杂。因此,您可以在以下代码中看到一个极其简单的示例:
import numpy as np

a = np.array([[1, 2], [3, 4]])
b = np.array([5, 6])

# 将 b 转换为列向量
b = b.reshape((b.shape[0], 1))
print(b)

# 将 a 和 b 水平拼接
x = np.concatenate((a, b), axis=1)
print(x)
输出:
[[5]
 [6]]
[[1 2 5]
 [3 4 6]]
我们使用 numpy 函数 savetxt 保存数据。别担心这个奇怪的名字,它只是为了好玩,原因很快就会清楚:
np.savetxt("squirrels.txt", # 文件名
           all_data,        # 要保存的数据
           fmt=['%.3f', '%.3f', '%1d']) # 格式化字符串,前两列浮点数,最后一列整数

print(all_data[:10])
输出:
[[ 1.72415394,  4.22895559,  0.        ],
 [ 4.16466507,  5.77817418,  1.        ],
 [ 4.51441156,  4.98274913,  1.        ],
 [ 1.49102772,  2.83351405,  0.        ],
 [ 6.0386362 ,  7.57298437,  2.        ],
 [ 5.61044976,  9.83428321,  2.        ],
 [ 5.69202866, 10.47239631,  2.        ],
 [ 6.14017298,  8.56209179,  2.        ],
 [ 2.97620068,  5.56776474,  1.        ],
 [ 8.27980017,  8.54824406,  2.        ]]
GENERATE SYNTHETICAL DATA WITH PYTHON
A problem with machine learning,
especially when you are starting out and
want to learn about the algorithms, is that
it is often difficult to get suitable test data.
Some cost a lot of money, others are not
freely available because they are protected
by copyright. Therefore, artificially
generated test data can be a solution in
some cases.
For this reason, this chapter of our tutorial
deals with the artificial generation of data.
This chapter is about creating artificial
data. In the previous chapters of our
tutorial we learned that Scikit-Learn
(sklearn) contains different data sets. On
the one hand, there are small toy data sets,
but it also offers larger data sets that are
often used in the machine learning
community to test algorithms or also serve
as a benchmark. It provides us with data
coming from the 'real world'.
All this is great, but in many cases this is
still not sufficient. Maybe you find the
right kind of data, but you need more data
of this kind or the data is not completely
the kind of data you were looking for, e.g.
maybe you need more complex or less
complex data. This is the point where you
should consider to create the data
yourself. Here, sklearn offers help. It
includes various random sample
generators that can be used to create
custom-made artificial datasets. Datasets
that meet your ideas of size and
complexity.
The following Python code is a simple example in which we create artificial weather data for some German
cities. We use Pandas and Numpy to create the data:
import numpy as np
40
import pandas as pd
cities = ['Berlin', 'Frankfurt', 'Hamburg',
'Nuremberg', 'Munich', 'Stuttgart',
'Hanover', 'Saarbruecken', 'Cologne',
'Constance', 'Freiburg', 'Karlsruhe'
]
n= len(cities)
data = {'Temperature': np.random.normal(24, 3, n),
'Humidity': np.random.normal(78, 2.5, n),
'Wind': np.random.normal(15, 4, n)
}
df = pd.DataFrame(data=data, index=cities)
df
Output:
Temperature
Humidity
Wind
Berlin
20.447301
75.516079
12.566956
Frankfurt
27.319526
77.010523
11.800371
Hamburg
24.783113
80.200985
14.489432
Nuremberg
25.823295
76.430166
19.903070
Munich
21.037610
81.589453
17.677132
Stuttgart
25.560423
75.384543
20.832011
Hanover
22.073368
81.704236
12.421998
Saarbruecken
25.722280
80.131432
10.694502
Cologne
25.658240
79.430957
16.360829
Constance
29.221204
75.626223
17.281035
Freiburg
25.625042
81.227281
6.850105
Karlsruhe
26.245587
81.546979
11.787846
41
ANOTHER EXAMPLE
We will create artificial data for four nonexistent types of flowers. If the names remind you of programming
languages and pizza, it will be no coincidence:
•
•
•
•
FlosFlosFlosFlosPythonem
Java
Margarita
artificialis
The RGB avarage colors values are correspondingly:
•
•
•
•
(255, 0, 0)
(245, 107, 0)
(206, 99, 1)
(255, 254, 101)
The average diameter of the calyx is:
•
•
•
•
3.8
3.3
4.1
2.9
Flos pythonem
(254, 0, 0)
Flos Java
(245, 107, 0)
Flos margarita
(206, 99, 1)
Flos artificialis
(255, 254, 101)
import matplotlib.pyplot as plt
import numpy as np
import pandas as pd
from scipy.stats import truncnorm
def truncated_normal(mean=0, sd=1, low=0, upp=10, type=int):
return truncnorm(
(low - mean) / sd, (upp - mean) / sd, loc=mean, scale=sd)
def truncated_normal_floats(mean=0, sd=1, low=0, upp=10, num=100):
res = truncated_normal(mean=mean, sd=sd, low=low, upp=upp)
return res.rvs(num)
def truncated_normal_ints(mean=0, sd=1, low=0, upp=10, num=100):
42
res = truncated_normal(mean=mean, sd=sd, low=low, upp=upp)
return res.rvs(num).astype(np.uint8)
# number of items for each flower class:
number_of_items_per_class = [190, 205, 230, 170]
flowers = {}
# flos Pythonem:
number_of_items = number_of_items_per_class[0]
reds = truncated_normal_ints(mean=254, sd=18, low=235, upp=256,
num=number_of_items)
greens = truncated_normal_ints(mean=107, sd=11, low=88, upp=127,
num=number_of_items)
blues = truncated_normal_ints(mean=0, sd=15, low=0, upp=20,
num=number_of_items)
calyx_dia = truncated_normal_floats(3.8, 0.3, 3.4, 4.2,
num=number_of_items)
data = np.column_stack((reds, greens, blues, calyx_dia))
flowers["flos_pythonem"] = data
# flos Java:
number_of_items = number_of_items_per_class[1]
reds = truncated_normal_ints(mean=245, sd=17, low=226, upp=256,
num=number_of_items)
greens = truncated_normal_ints(mean=107, sd=11, low=88, upp=127,
num=number_of_items)
blues = truncated_normal_ints(mean=0, sd=10, low=0, upp=20,
num=number_of_items)
calyx_dia = truncated_normal_floats(3.3, 0.3, 3.0, 3.5,
num=number_of_items)
data = np.column_stack((reds, greens, blues, calyx_dia))
flowers["flos_java"] = data
# flos Java:
number_of_items = number_of_items_per_class[2]
reds = truncated_normal_ints(mean=206, sd=17, low=175, upp=238,
num=number_of_items)
greens = truncated_normal_ints(mean=99, sd=14, low=80, upp=120,
num=number_of_items)
blues = truncated_normal_ints(mean=1, sd=5, low=0, upp=12,
num=number_of_items)
calyx_dia = truncated_normal_floats(4.1, 0.3, 3.8, 4.4,
num=number_of_items)
data = np.column_stack((reds, greens, blues, calyx_dia))
flowers["flos_margarita"] = data
43
# flos artificialis:
number_of_items = number_of_items_per_class[3]
reds = truncated_normal_ints(mean=255, sd=8, low=2245, upp=2255,
num=number_of_items)
greens = truncated_normal_ints(mean=254, sd=10, low=240, upp=255,
num=number_of_items)
blues = truncated_normal_ints(mean=101, sd=5, low=90, upp=112,
num=number_of_items)
calyx_dia = truncated_normal_floats(2.9, 0.4, 2.4, 3.5,
num=number_of_items)
data = np.column_stack((reds, greens, blues, calyx_dia))
flowers["flos_artificialis"] = data
data = np.concatenate((flowers["flos_pythonem"],
flowers["flos_java"],
flowers["flos_margarita"],
flowers["flos_artificialis"]
), axis=0)
# assigning the labels
target = np.zeros(sum(number_of_items_per_class)) # 4 flowers
previous_end = 0
for i in range(1, 5):
num = number_of_items_per_class[i-1]
beg = previous_end
target[beg: beg + num] += i
previous_end = beg + num
conc_data = np.concatenate((data, target.reshape(target.shape[0],
1)),
axis=1)
np.savetxt("data/strange_flowers.txt", conc_data, fmt="%2.2f",)
import matplotlib.pyplot as plt
target_names = list(flowers.keys())
feature_names = ['red', 'green', 'blue', 'calyx']
n = 4
fig, ax = plt.subplots(n, n, figsize=(16, 16))
colors = ['blue', 'red', 'green', 'yellow']
for x in range:
44
for y in range:
xname = feature_names[x]
yname = feature_names[y]
for color_ind in range(len(target_names)):
ax[x, y].scatter(data[target==color_ind, x],
data[target==color_ind, y],
label=target_names[color_ind],
c=colors[color_ind])
ax[x, y].set_xlabel(xname)
ax[x, y].set_ylabel(yname)
ax[x, y].legend(loc='upper left')
plt.show()
45
GENERATE SYNTHETIC DATA WITH SCIKIT-LEARN
It is a lot easier to use the possibilities of Scikit-Learn to create synthetic data.
The functionalities available in sklearn can be grouped into
1.
2.
3.
4.
Generators for classifictation and clustering
Generators for creating data for regression
Generators for manifold learning
Generators for decomposition
46
GENERATORS FOR CLASSIFICATION AND CLUSTERING
We start with the the function make_blobs of sklearn.datasets to create 'blob' like data
distributions. By setting the value of centers to n_classes , we determine the number of blobs, i.e.
the clusters. n_samples corresponds to the total number of points equally divided among clusters. If
random_state is not set, we will have random results every time we call the function. We pass an int to
this parameter for reproducible output across multiple function calls.
import numpy as np
import matplotlib.pyplot as plt
from sklearn.datasets import make_blobs
n_classes = 4
data, labels = make_blobs(n_samples=1000,
centers=n_classes,
random_state=100)
labels[:7]
Output:array([1, 3, 1, 3, 1, 3, 2])
We will visualize the previously created blob custers with matplotlib:
fig, ax = plt.subplots()
colours = ('green', 'orange', 'blue', "pink")
for label in range(n_classes):
ax.scatter(x=data[labels==label, 0],
y=data[labels==label, 1],
c=colours[label],
s=40,
label=label)
ax.set(xlabel='X',
ylabel='Y',
title='BlobsExamples')
ax.legend(loc='upper right')
47
Output:<matplotlib.legend.Legend at 0x7f50f92a4640>
The centers of the blobs were randomly chosen in the previous example. In the following example we set the
centers of the blobs explicitly. We create a list with the center points and pass it to the parameter centers :
import numpy as np
import matplotlib.pyplot as plt
from sklearn.datasets import make_blobs
centers = [[2, 3], [4, 5], [7, 9]]
data, labels = make_blobs(n_samples=1000,
centers=np.array(centers),
random_state=1)
labels[:7]
Output:array([0, 1, 1, 0, 2, 2, 2])
Let us have a look at the previously created blob clusters:
fig, ax = plt.subplots()
colours = ('green', 'orange', 'blue')
for label in range(len(centers)):
ax.scatter(x=data[labels==label, 0],
y=data[labels==label, 1],
c=colours[label],
s=40,
48
label=label)
ax.set(xlabel='X',
ylabel='Y',
title='BlobsExamples')
ax.legend(loc='upper right')
Output:<matplotlib.legend.Legend at 0x7f50f91eaca0>
Usually, you want to save your artificially created datasets in a file. For this purpose, we can use the function
savetxt from numpy. Before we can do this we have to reaarange our data. Each row should contain both
the data and the label:
import numpy as np
labels = labels.reshape((labels.shape[0],1))
all_data = np.concatenate((data, labels), axis=1)
all_data[:7]
Output:array([[ 1.72415394,
4.22895559,
0.
],
[ 4.16466507, 5.77817418,
1.
],
[ 4.51441156, 4.98274913,
1.
],
[ 1.49102772, 2.83351405,
0.
],
[ 6.0386362 , 7.57298437,
2.
],
[ 5.61044976, 9.83428321,
2.
],
[ 5.69202866, 10.47239631,
2.
]])
49
For some people it might be complicated to understand the combination of reshape and concatenate.
Therefore, you can see an extremely simple example in the following code:
import numpy as np
a = np.array( [[1, 2], [3, 4]])
b = np.array( [5, 6])
b = b.reshape((b.shape[0], 1))
print(b)
x = np.concatenate( (a, b), axis=1)
x
[[5]
[6]]
Output:array([[1, 2, 5],
[3, 4, 6]])
We use the numpy function savetxt to save the data. Don't worry about the strange name, it is just for fun
and for reasons which will be clear soon:
np.savetxt("squirrels.txt",
all_data,
fmt=['%.3f', '%.3f', '%1d'])
all_data[:10]
Output:array([[ 1.72415394,
4.22895559,
0.
[ 4.16466507, 5.77817418,
1.
[ 4.51441156, 4.98274913,
1.
[ 1.49102772, 2.83351405,
0.
[ 6.0386362 , 7.57298437,
2.
[ 5.61044976, 9.83428321,
2.
[ 5.69202866, 10.47239631,
2.
[ 6.14017298, 8.56209179,
2.
[ 2.97620068, 5.56776474,
1.
[ 8.27980017, 8.54824406,
2.
],
],
],
],
],
],
],
],
],
]])